|
Hardware failures are responsible for approximately half of IT system outages. Left unchecked, resource consumption make identifying issues (battery run downs, excessive heat, power fluctuations, etc.) challenging. Monitoring hardware health can help minimize server and application downtime and reduce business risks.
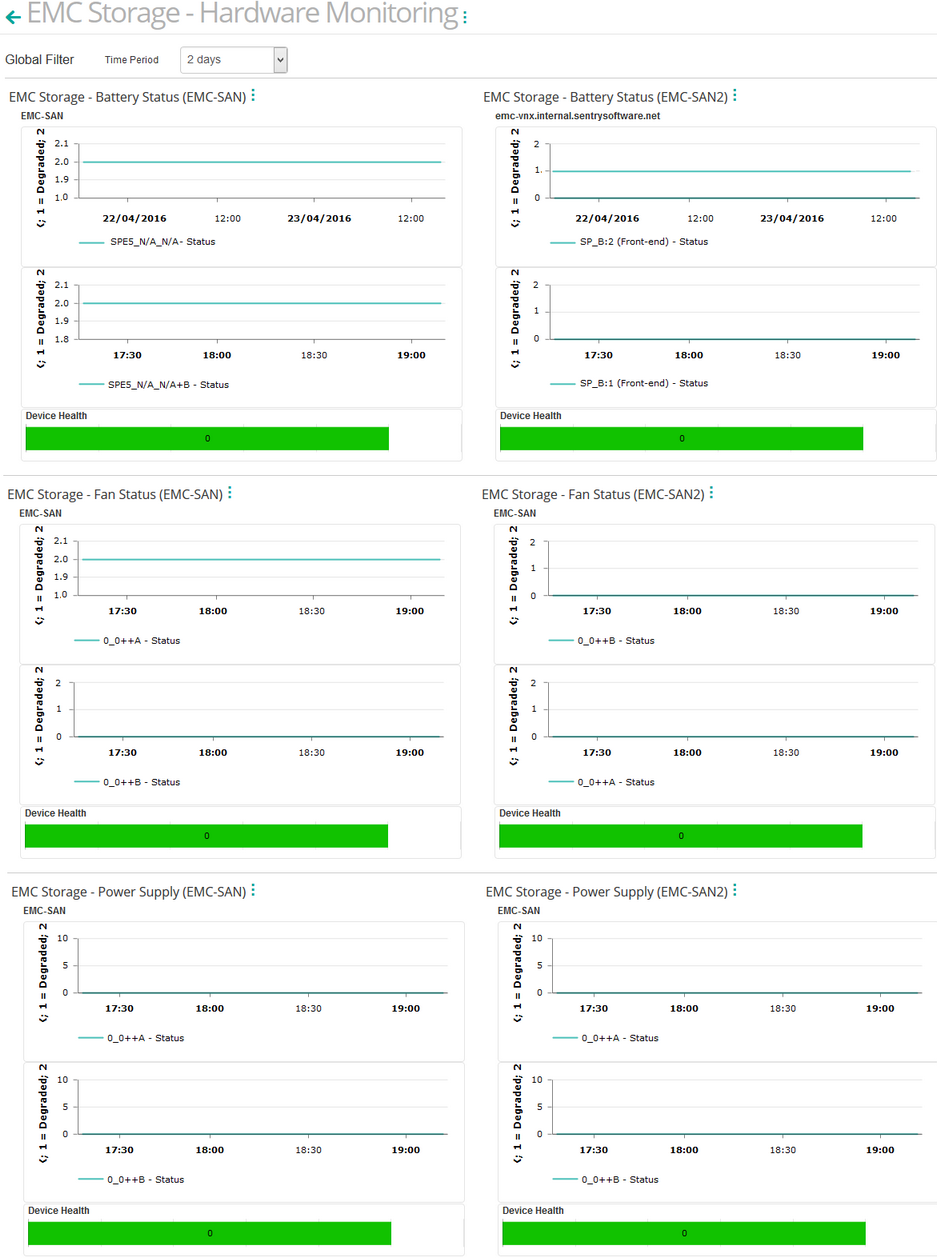
To diagnose and predict hardware components failures, you will need to create a three-row dashboard that reports on the elements that are most likely to fail in a storage system. This topic illustrates how to monitor batteries, fans, and power supplies for two storage systems. Dashboards allows you to gather specific types of data and display them in a consolidated graphical format. For detailed information about dashboards options and features, refer to the BMC documentation.
To Monitor Hardware Components
| 1. | Login to your BMC TrueSight Operations Management console. |
| 2. | Select Dashboards from the navigation pane. |
| 3. | In the Dashboards page, click Add Dashboard or select Add Dashboard from the dashboard action menu  . . |

| 4. | Enter a Title for your dashboard and configure a Global Filter, if needed. |
| 5. | Click Add Dashlet to open the dashlet library for the first column of the row. |
| 6. | From the dashlet library, select the Device Performance template, and then click Close. |
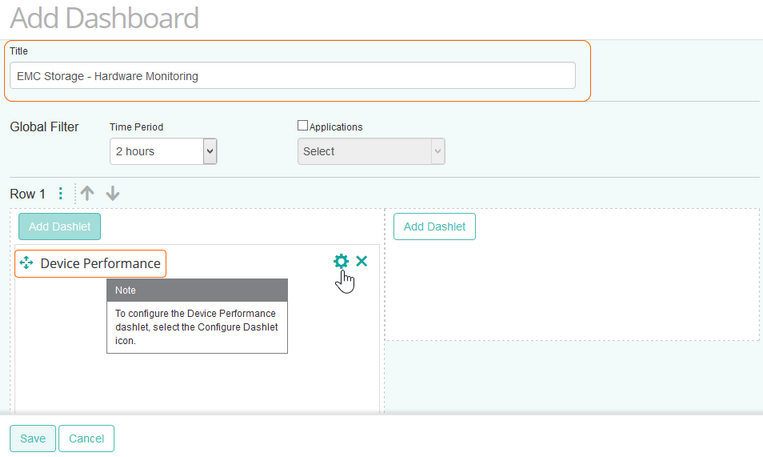
| 7. | Select Configure Dashlet by clicking the  button. button. |
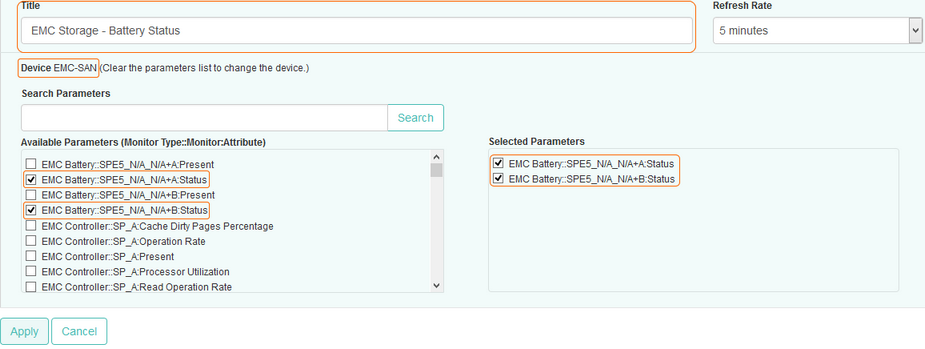
| 8. | In the panel of input fields and options that opens below the dashboard, enter a Title for the dashlet and specify a Refresh Rate (default is 5 minutes). |
| 9. | Select the EMC storage device for which you to monitor hardware components. |
| 10. | Select the Status parameter of the batteries of the storage system and click Apply.
Monitoring storage systems' batteries can greatly reduce the risk of unplanned downtime by providing immediate notification of detected faults. It also helps planning battery replacement in a properly timed and budgeted manner. |
Tip
To quickly retrieve a component or a parameter, enter its name in the Search Parameters field and click Search.
|
| 11. | Repeat this operation in the second column of the dashboard for the fans.
Even though data centers and servers are cooled with air conditioning and fans, computing systems may be overheated. The temperature of the interior of the case of a storage system is controlled with fans. To prevent ambient temperature to get too high, you need to closely monitor the fan sensors to ensure the component is properly working: |
| • | Select the Status parameters of the fans of the storage system and click Apply. |
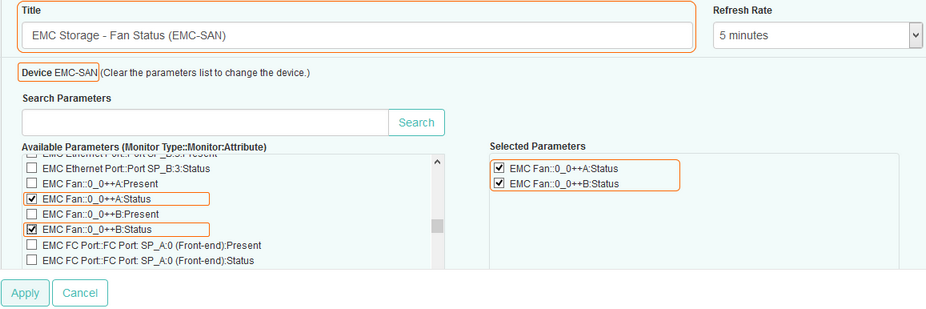
 A degraded fan should be replaced immediately. A degraded fan should be replaced immediately.
| 12. | Finally, configure the dashlet of the third column of the dashboard to monitor the storage system power supply.
After hard drives, the power supply is the device that is most likely to fail. The proper operation of this device highly depends on the quality of the data center electrical distribution. Indeed, voltage fluctuations are detrimental to power supplies: they can shorten their life span or impair them. |
| • | Select the Status parameters of the power supplies of the storage system and click Apply. |
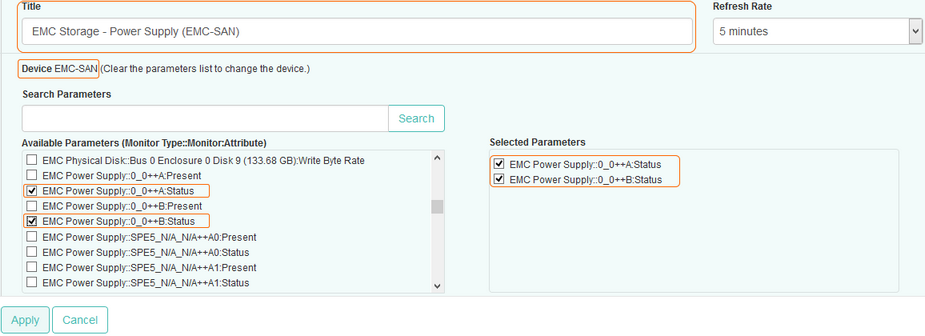
| 13. | The dashboard is completed and shows the status of batteries, fans and power supplies of the storage system. |
Related Topics
Monitoring your Storage Environment
Creating Consolidated Data Views with Dashboards
EMC Battery
EMC Fan
EMC Power Supply
|


