Detecting High Processor Utilization


Detecting High Processor Utilization |
|
|
A storage controller overload can lead to unpredictable performance degradations in a disk array. To prevent such problems, administrators need to monitor the processor utilization on each controller to identify which one may potentially become a bottleneck.
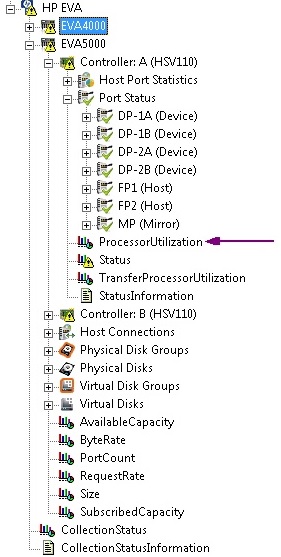
Selecting a Controller's Processor Utilization Parameter
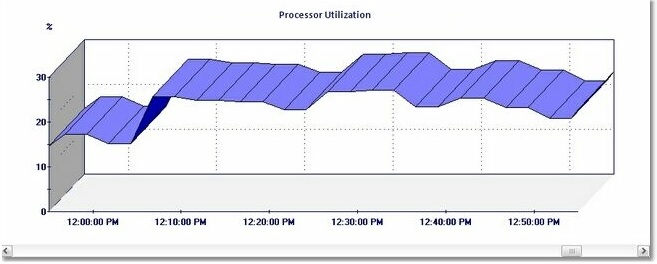
Viewing a Controller's Processor Utilization as a Graph A processor utilization over 80% means that this controller is overloaded and that the controller constitutes a bottleneck for the disk array. Also, it is also usually considered that a processor average utilization above 50% on both controllers constitutes an important risk as one single controller would not be able to handle the entire load of the disk array in case of a controller fail over. That is the reason a warning threshold is set at 50%. Verify the Transfer Data Processor Utilization.
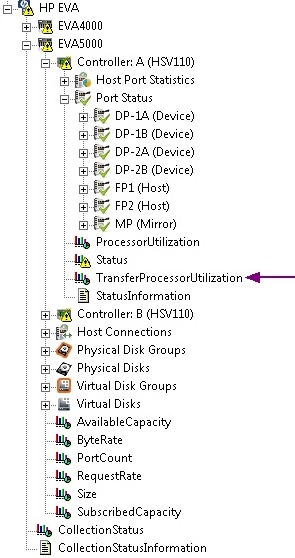
Controller's TransferProcessorUtilization Parameter
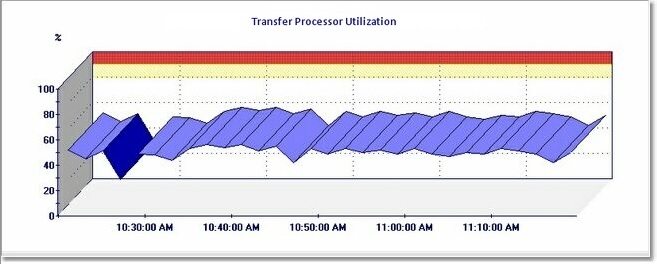
Controller's Transfer Processor Utilization If this value stays low – while the overall processor utilization is high – it indicates that the controller is performing "non productive" tasks. It then may become critical to determine the source of activity that generates the high processor utilization. By default, the ProcessorUtilization parameter will display a warning when reaching 50% and an alert when reaching 90 %. See also |