|
To identify the volumes that generate the most traffic on the storage system, use the ReadByteRate and WriteByteRate parameters of the Volumes class. IBM XiV KM for PATROL offers you two methods to visually represent a volume traffic.
Creating a multi-parameter graph with the ReadByteRate and WriteByteRate of the volumes you are suspecting
| 1. | In the console, double-click the ReadByteRate parameter of the volume you are interested in. A graph is automatically displayed in the graph pane. |
| 2. | Then drag and drop the WriteByteRate in the graph window |
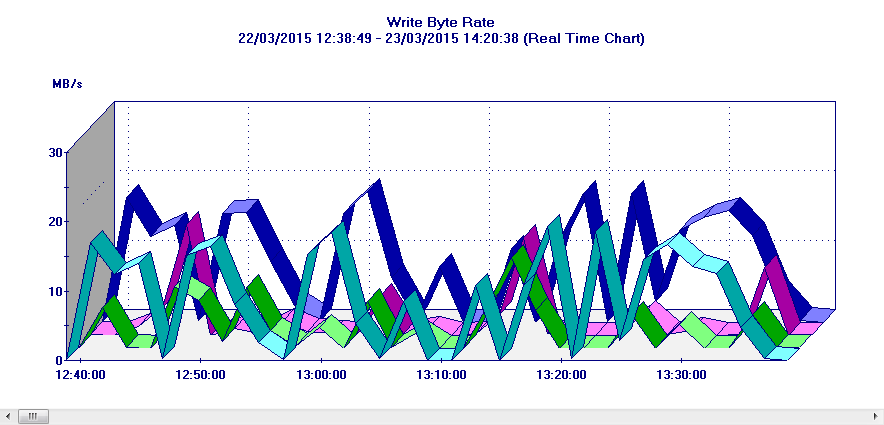
Graph – Read Byte Rate vs Write Byte Rate on a volume
Using the Volume Activity... Command
| 1. | Right-click the Volumes container for which you want to create a daily or hourly report of the total amount of data in GB that was read off or written to the each volume, and select Volumes Activity... |
| 2. | Define the report settings |
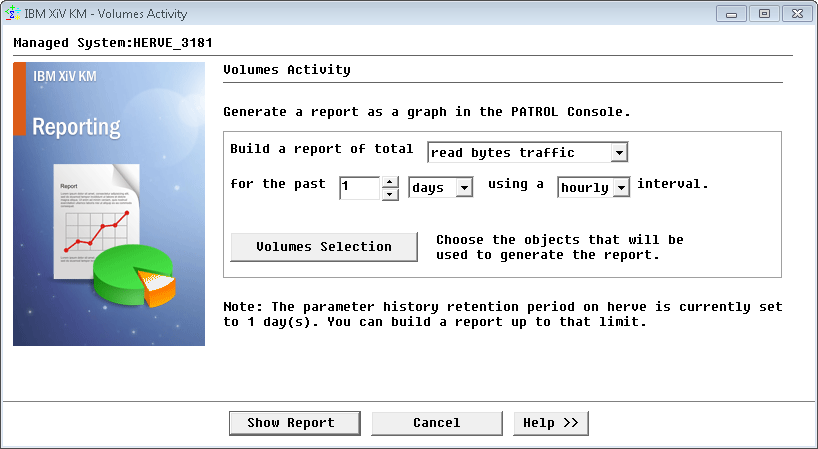
Setting Report Parameters
| • | Select the data you wish to generate a report for: Read Bytes, Write Bytes or both |
| • | Select the period that you wish the report to cover: number of days or hours |
| • | Select the interval to apply to the report data: hourly or daily |
| 3. | Click the Show Report button to display the graph. |
|


