|
A processor overload can lead to unpredictable performance degradations. To prevent such problems, administrators need to monitor the Processor Utilization on each filer to diagnose whether the filer processor constitutes the performance bottleneck.
| 1. | Create a PATROL Query in the PATROL Console to show the value of the ProcessorUtilization parameter of the SEN_NAP_7|SEN_NAP_C_PROCESSOR application class. |
| 2. | Open PATROL Central Operator Taskpad. |
| 3. | In the Action menu of the PATROL console, click New Query. |
| ▪ | Enter the Query Name (example: High Processor Utilization) |
| ▪ | Enter the Query Description (optional) |
| ▪ | In the Query Results Filter section, select Show Selected Objects and check the Parameters box |
| ▪ | In the Additional Filtering section, select the Enable Application Class level filtering and the Enable Parameter level filtering options |
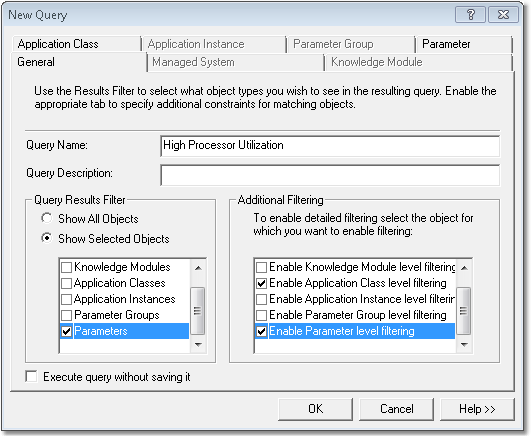
PATROL Query – General Tab
| 5. | Open the Application Class tab. In the Pattern Matching section, select Like and type: |
| • | SEN_NAP_7_PROCESSOR if you are in 7-Mode. |
| • | SEN_NAP_C_PROCESSOR if you are in C-Mode. |
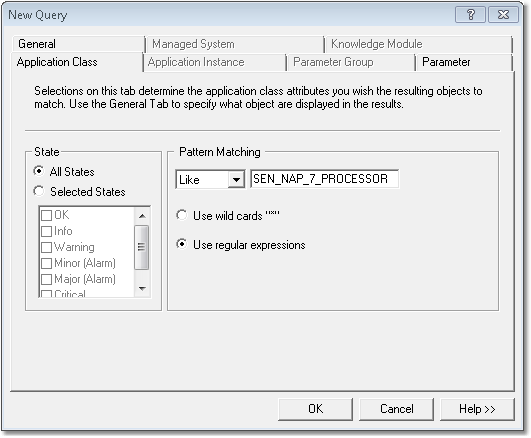
PATROL Query – Application Class Tab
| 6. | Open the Parameter tab. In the Pattern Matching section, select Like and type ProcessorUtilization. |
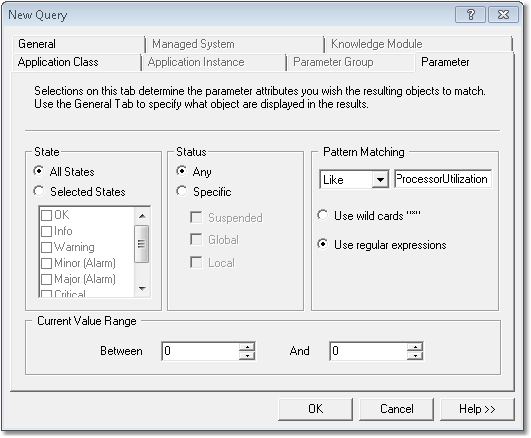
PATROL Query – Parameter Tab
| 7. | Click OK to display the results of the query. |
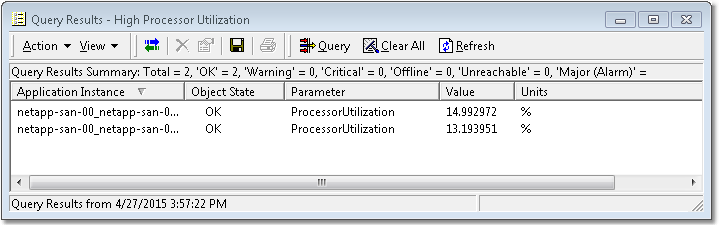
PATROL Query – Results
A processor utilization over 80% means that this controller is overloaded and that the filer constitutes a bottleneck.
See also
SEN_NAP_7_PROCESSOR
|


