|
Making sure that a filer has enough remaining disk space available is critical for several reasons:
| • | SAN administrators want to make sure to be able to provision disk space for new servers and users when requested, as quickly as possible. |
| • | The filer itself may need additional disk space for specific features to work properly, like automatic snapshots, mirroring, etc. |
| • | Users and applications actively using a share on the filer will surely be severely impacted by the fatal "File system is full" error message |
The disk space used is permanently monitored for each aggregate and each volume with the SEN_NAP_7|C_AGGREGATE, SEN_NAP_7|C_VOLUME and SEN_NAP_C_NODE_ROOTVOLUME application classes.
Reporting Disk Space Consumption on a Volume and an Aggregate
| ▪ | Open PATROL Central Operator Taskpad. |
| ▪ | In the Action menu of the PATROL console, click New Query. |
| ▪ | Enter the Query Name (example: NetApp - Space Disk Consumption) |
| ▪ | Enter the Query Description (optional) |
| ▪ | In the Query Results Filter section, select Show Selected Objects and check the Parameters box |
| ▪ | In the Additional Filtering section, select the Enable Application Class level filtering and the Enable Parameter level filtering options |
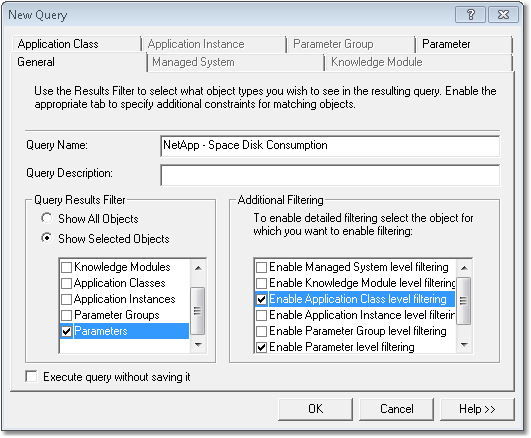
PATROL Query – General Tab
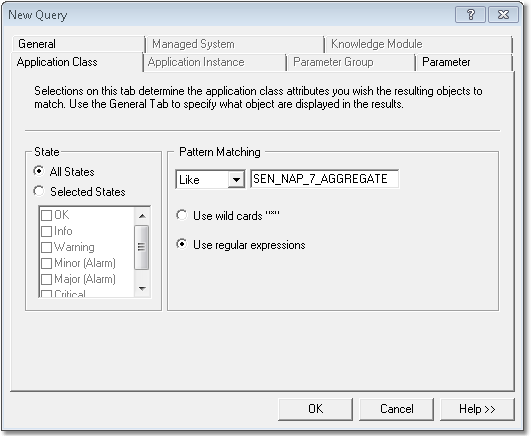
| 5. | Open the Application Class tab. In the Pattern Matching section, select Like and type: |
| • | SEN_NAP_7_AGGREGATE or SEN_NAP_7_VOLUME if you are in 7-Mode. |
| • | SEN_NAP_C_AGGREGATE, SEN_NAP_C_VOLUME, or SEN_NAP_7_NODE_ROOTVOLUME if you are in C-Mode. |
| 3. | Open the Parameter tab and, in the Pattern Matching section, select Like and type AvailableCapacityPercentage. |
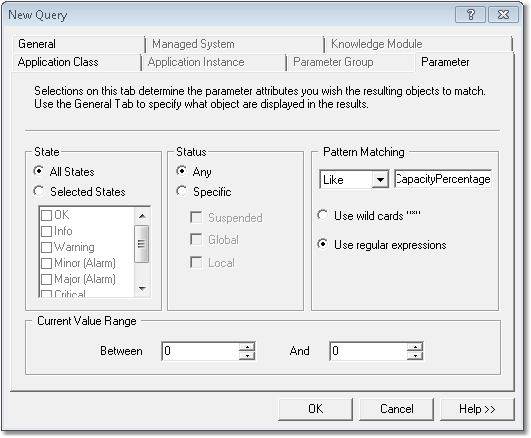
PATROL Query – Parameter Tab
| 4. | Click OK to display the results of the query. |
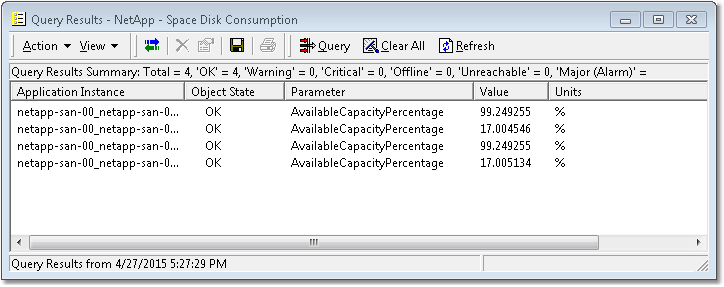
PATROL Query – Query Result
|


