|
To identify the LUNs that generate the most traffic on the disk array, use the TransferByteRate parameter of the volume class. Hitachi Disk Arrays KM for PATROL offers you two methods to visually represent a LUN traffic.
Create PATROL query with the TransferByteRate of the volume you are suspecting
| 1. | Create a PATROL Query in the PATROL Console to show the value of the TransferByteRate parameter of the SEN_HDS_VOLUME class. In the main menu bar, click Action > New Query… |
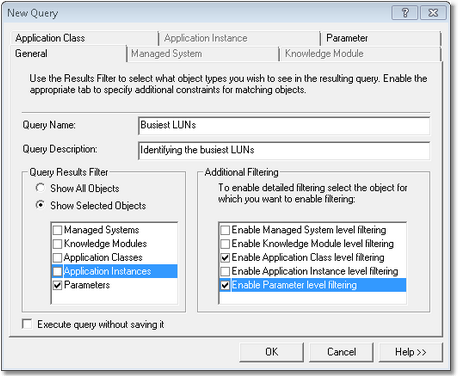
PATROL Query - General Settings
| 2. | Enter the Query name (example: Busiest LUNs) |
| 3. | Enter the Query description (optional) |
| 4. | In the Query Results Filter section, select Show Selected Objects and check the Parameters box |
| 5. | In the Additional Filtering, select the Enable Application Class level filtering and the Enable Parameter level filtering options |
| 6. | Open the Application Class tab |
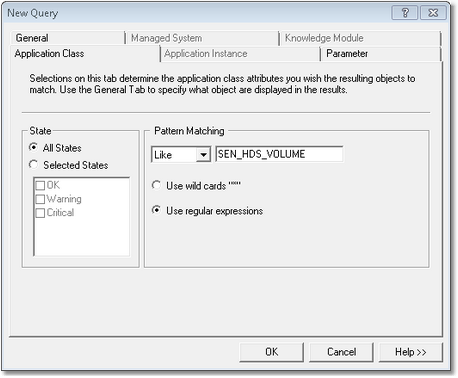
PATROL Query - Application Class Tab
| 7. | In the Pattern Matching section, select Like and type SEN_HDS_VOLUME |
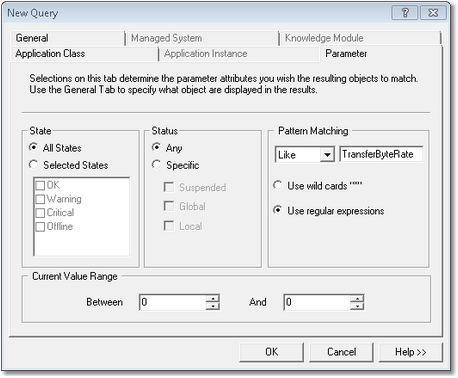
PATROL Query - Parameter Tab
| 9. | In the Pattern Matching section, select Like and type TransferByteRate |
| 10. | Click OK to display a table with the amount of actually consumed capacity in all of the storage pools of your monitored Hitachi disk arrays |
Use the Volume Activity Command
| 1. | Right-click the Volume container which will help you create a daily or hourly report of the total amount of data in GB that was read off or written to the each LUN. |
| 2. | Define the report settings |
| • | The Transfer Byte Traffic parameter is automatically selected |
| • | Select the period that you wish the report to cover: number of days or hours |
| • | Select the interval to apply to the report data: hourly or daily |
| 3. | Click the Show Report button to display the graph |
 Once you have identified the most busy LUNs, check the infobox of the suspected LUNs to find their storage groups and the hosts that generate such traffic. Once you have identified the most busy LUNs, check the infobox of the suspected LUNs to find their storage groups and the hosts that generate such traffic.
|


