|
To identify the logical drives that generate the most traffic on the subsystem, use the Transfer Byte Rate attribute of the IBM DS Logical Drive monitor type. BMC ProactiveNet Performance Management - IBM DS3000 DS4000 DS5000 Series Storage Monitoring offers you two methods to visually represent a logical drive traffic.
Identify the busiest logical drives
| 1. | Log on to the BMC ProactiveNet Operations Console. |
| 2. | Display the list of devices monitored by BPPM: |
| • | In the Navigation frame, select the Main drawer. |
| • | Click  to display the list of devices in a grid. to display the list of devices in a grid. |
| 3. | Click the subsystem of the logical drives you need to compare the activity. |
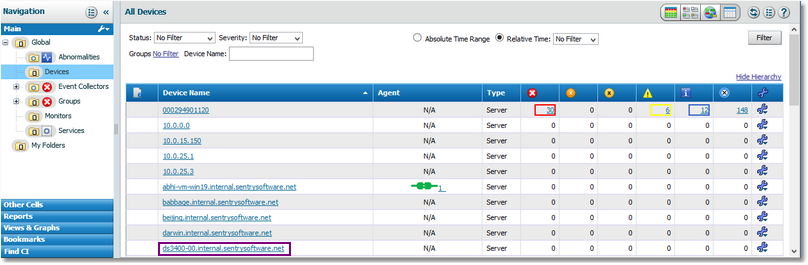
Selecting a Device
| 4. | The list of monitors for your device is displayed. Select the first logical drive for which you need to view the activity. |
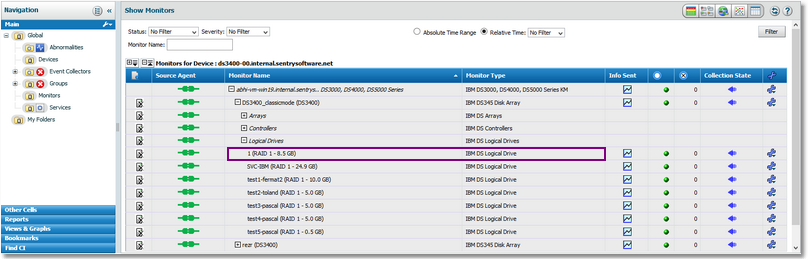
Displaying the Monitors
| 5. | Click  for the chosen disk array. for the chosen disk array. |
| 6. | By default, the Transfer Byte Rate attribute is already displayed. |
| 7. | Add the graph to the view: |
| • | Click  . The following pop-up is displayed: . The following pop-up is displayed: |
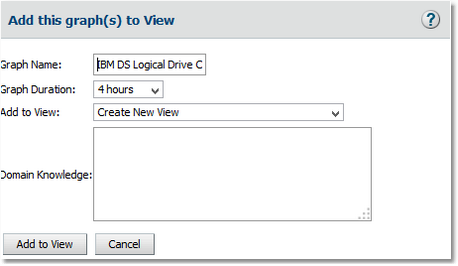
Adding a Graph to View - Step 1
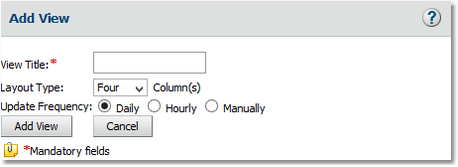
Adding a Graph to View - Step 2
| • | In the View Title field, type Busiest Logical Drives and click Add View. The View created successfully message appears. Click Close. |
| 8. | The Busiest Logical Drives view is now created and available under the Views & Graphs drawer in the Navigation pane. |
| 9. | Create a graph for all the other logical drives you wish to compare and add them to the Busiest Logical Drives view. |
|


