Monitoring the Efficiency of the Caching Mechanism


Monitoring the Efficiency of the Caching Mechanism |
|
|
IBM DS6000, DS8000 Series KM for PATROL monitors the efficiency of the different caching mechanisms of the DS6000 and DS8000 disk arrays. The monitoring is performed on a per-volume basis with the following parameters: •CacheFastWriteHitRatio: reports on the number of blocks that were successfully served by Cache Fast Write (CFW). •DASDFastWriteHitRatio: reports on the number of blocks that were successfully served by DASD Fast Write (DFW). •ReadCacheHitRatio: reports on the number of blocks that were successfully read and served by one of the available cache mechanisms. The CacheFastWriteHitRatio and DASDFastWriteHitRatio parameters deal more specifically with the physical writing of data to the disk, while the ReadCacheHitRatio parameter reflects the cache efficiency for the read operations on the volume. The higher the values, the better. CacheFastWriteHitRatio and DASDFastWriteHitRatio values dropping below 50% for a significant amount of time indicates a lack of cache memory for the current workload, and that the physical bandwidth on the disk constitutes the limiting performance factor. Querying 'HitRatio' parameters1.Create a PATROL Query in the PATROL Console to show the value of the CacheFastWriteHitRatio, DASDFastWriteHitRatio and ReadCacheHitRatio parameters of the SEN_I68_VOLUME class; In the main menu bar, click Action > New Query…
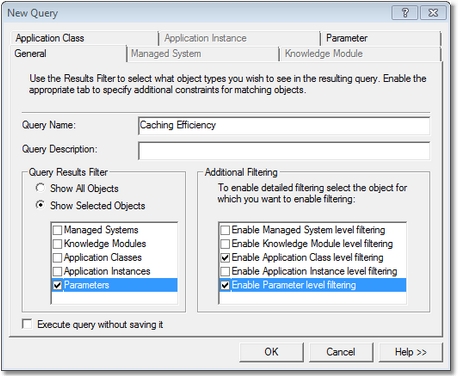
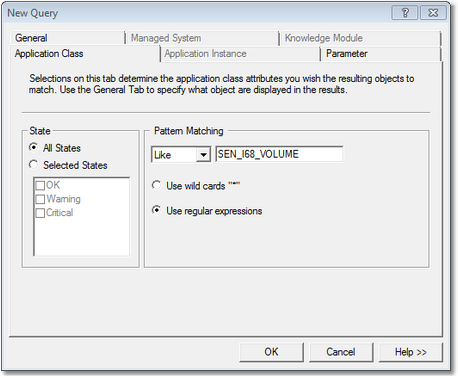
PATROL Query – General Tab 2.Enter the Query name (example: Caching Efficiency) 3.Enter the Query description (optional) 4.In the Query Result Filter section, select Show Selected Objects and check the Parameters box 5.In the Additional Filtering section, select the Enable Application Class level filtering and the Enable Parameter level filtering options 6.Open the Application Class tab 7.In the Pattern Matching section, select Like and type SEN_I68_VOLUME
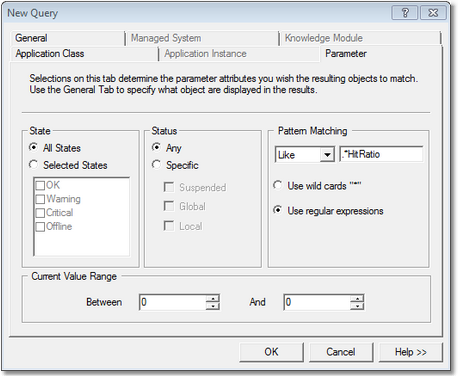
PATROL Query – Application Class Tab 8.Open the Parameter tab 9.In the Pattern Matching section, select Like and type .*HitRatio
PATROL Query – Parameter Tab 10.Click OK to display a table displaying the amount of actually consumed capacity in all the extent pools of your monitored IBM environment. Another easy way to get detailed information regarding the Hit Ratio parameters consists in generating a graph for each of them. Simply double-click the CacheFastWriteHitRatio, DASDFastWriteHitRatio and ReadCacheHitRatio parameters of a volume to display a graph in the right pane of your PATROL Console. Then, adjust the display and history range according to your needs (refer to your PATROL Console documentation for detailed information on graphs).
See also |