|
Making sure that a filer has enough remaining disk space available is critical for several reasons:
| • | SAN administrators want to make sure to be able to provision disk space for new servers and users when requested, as quickly as possible. |
| • | The filer itself may need additional disk space for specific features to work properly, like automatic snapshots, mirroring, etc. |
| • | Users and applications actively using a share on the filer will surely be severely impacted by the fatal "File system is full" error message |
The disk space used is permanently monitored for each aggregate and each volume with the NetApp Aggregate and NetApp Volume Monitor Types.
To determine the actual disk space consumption for a storage system, you will need to create a simple two-column dashboard. Dashboards allow you to gather specific types of data and display them in a consolidated graphical format. For detailed information about dashboards options and features, refer to the BMC documentation.
To Report on Disk Space Consumption on a Volume or Aggregate
| 1. | Login to your BMC TrueSight Operations Management console. |
| 2. | Select Dashboards from the navigation pane. |
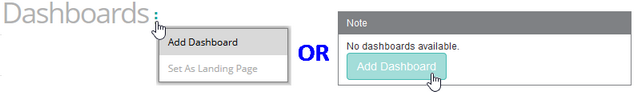
| 3. | In the Dashboards page, click Add Dashboard or select Add Dashboard from the dashboard action menu  . . |
| 4. | Enter a Title for your dashboard and configure a Global Filter, if needed. |
| 5. | Click Add Dashlet to open the dashlet library for the first column of the row. |
| 6. | From the dashlet library, select the Device Performance template, and then click Close. |
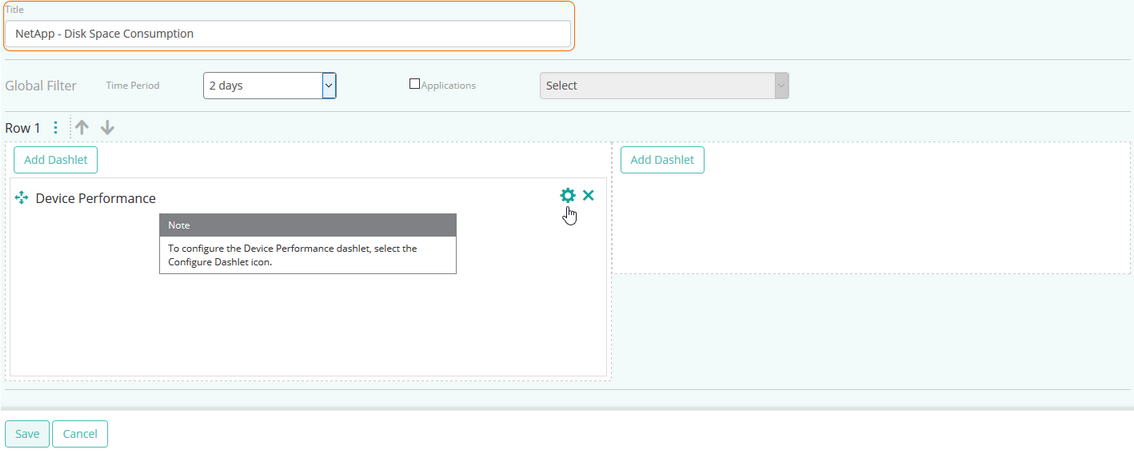
| 7. | Select Configure Dashlet by clicking the  button. button. |
| 8. | In the panel of input fields and options that opens below the dashboard, enter a Title for the dashlet and specify a Refresh Rate (default is 5 minutes). |
| 9. | Select the NetApp storage device for which you want to compare processors utilization. |
| 10. | Select the Available Capacity and the Available Capacity Percentage parameters for the first volume or aggregate, and click Apply. |
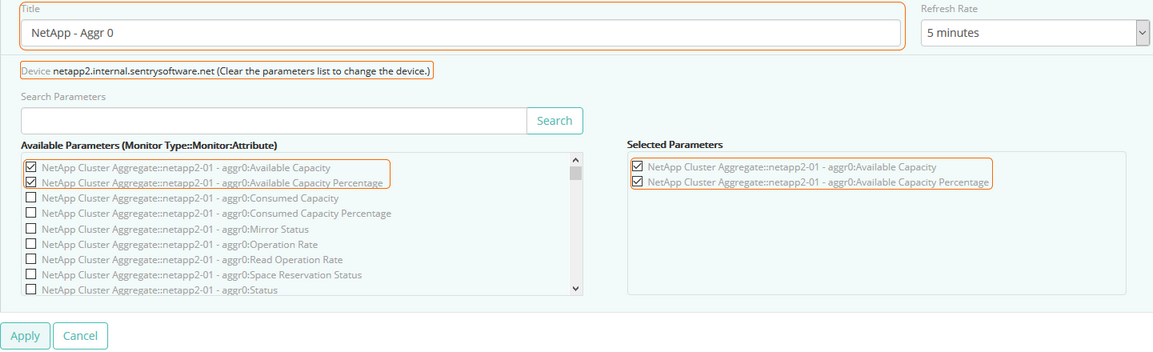
Tip
To quickly retrieve a component or a parameter, enter its name in the Search Parameters field and click Search.
|
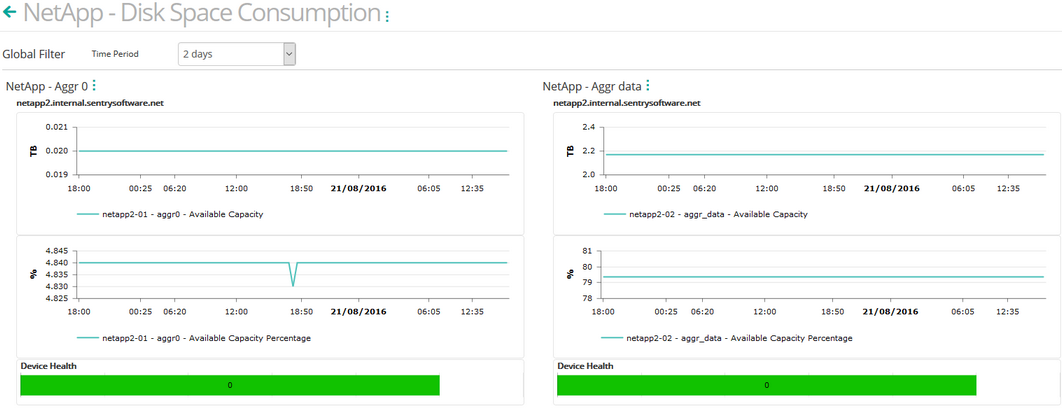
| 11. | Repeat this operation in the next column of the dashboard for another volume or aggregate and click Save. |
| 12. | The dashboard is completed and shows the space consumption for the selected volumes or aggregates. |
Related Topics
Monitoring your Storage Environment
Creating Consolidated Data Views with Dashboards
NetApp Aggregate
NetApp Volume
|


