To identify Unmapped (Orphans) LUNs
Over time, as servers connected to a SAN get decommissioned, administrators find an increasing number of unmapped LUNs, or volumes that are no longer used by any server. These LUNs, while unused, still occupy disk space in the filer. Being able to identify such unmapped LUNs and reclaim the disk space uselessly consumed by these LUNs will help administrators avoid unnecessary upgrades and extensions of their filers. To know the LUNs in a filer that are not mapped to any server and therefore safe to remove, you can generate an automatic LUNs Mapping Table report.
To identify Unused LUNs
When a server is decommissioned or reconfigured, its associated LUNs can stay mapped preventing storage administrator from accurately identifying unused LUNs. Since the solution monitors permanently the traffic on each LUN, it becomes easy to detect LUNs for which the activity is null.
To identify unused LUNs, you will need to create a simple one-row dashboard. Dashboards allow you to gather specific types of data and display them in a consolidated graphical format. For detailed information about dashboards options and features, refer to the BMC documentation.
| 1. | Login to your BMC TrueSight Operations Management console. |
| 2. | Select Dashboards from the navigation pane. |
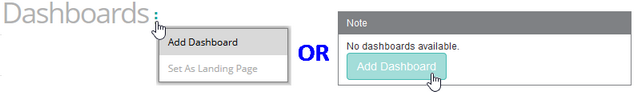
| 3. | In the Dashboards page, click Add Dashboard or select Add Dashboard from the dashboard action menu  . . |
| 4. | Enter a Title for your dashboard and configure a Global Filter, if needed |
| 5. | Click Add Dashlet to open the dashlet library for the first column of the row. |
| 6. | From the dashlet library, select the Monitors - Top/Bottom Performers template. |
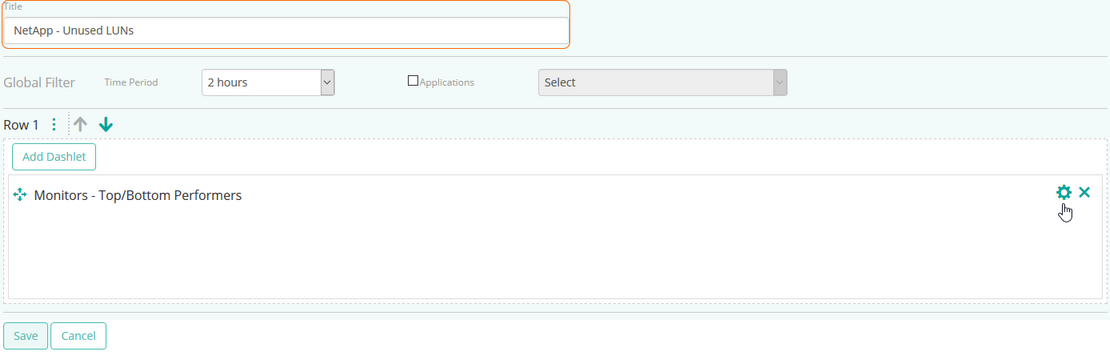
| 7. | Select Configure Dashlet by clicking the  button. button. |
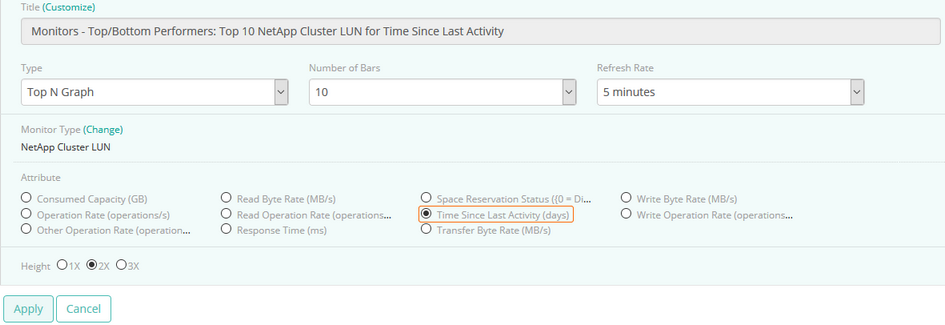
| 8. | In the panel of input fields and options that opens below the dashboard, enter a Title for the dashlet and specify a Refresh Rate (default is 5 minutes). |
| 9. | Select the Monitor Type for which you want to create a graph. |
| 10. | Configure the graph parameters: |
| • | In the Type field, select Top N Graph, |
| • | In the Number of Bars field, select the number of LUNs for which you need to compare activity (default is 10), |
| 12. | Select the Time Since Last Activity parameter, and click Apply. |
| 13. | The dashboard is completed and shows the top x LUNs with the higher number of days of inactivity. Pass the mouse over a bar to view the average, high and low values for a LUN. |
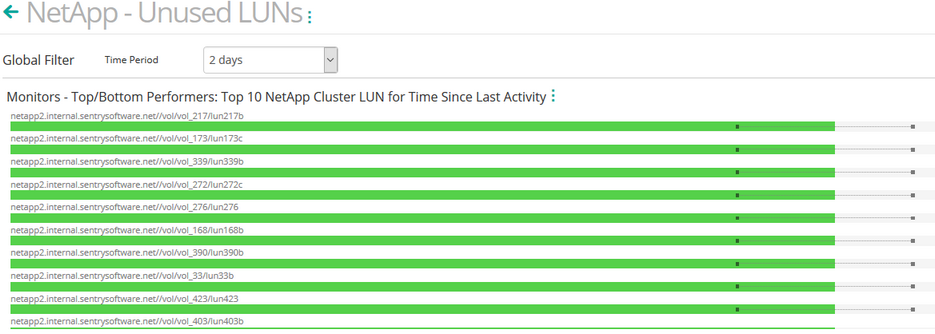
Storage space in LUNs with a high Time Since Last Activity value can be reclaimed. The freed storage space is then available for other file systems created in a given storage pool.
 The value collected for this attribute upon the first collect reflects the number of days since any activity occurred on the LUN/volume for the time observed by the monitoring solution, i.e. this first collected metric might not reflect the actual absence of activity on the volume. The value collected for this attribute upon the first collect reflects the number of days since any activity occurred on the LUN/volume for the time observed by the monitoring solution, i.e. this first collected metric might not reflect the actual absence of activity on the volume.
Related Topics
Monitoring your Storage Environment
Creating Consolidated Data Views with Dashboards
NetApp LUN
|


