Viewing the Overall Activity of a NetApp Filer


Viewing the Overall Activity of a NetApp Filer |
|
|
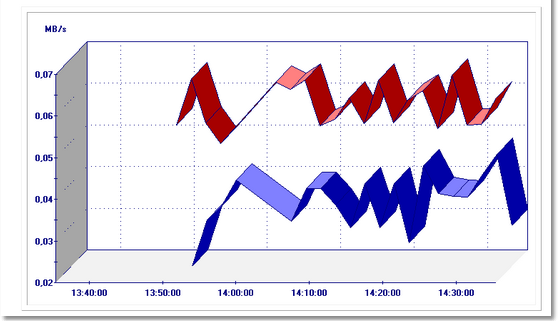
In order to visualize the activity of a NetApp Filer, use the DiskReadByteRate and DiskWriteByteRate parameters of the SEN_NAP_7_CONTROLLER (7-Mode) or SEN_NAP_C_NODE (C-Mode) application classes. These parameters represent the overall traffic in megabytes per second for each monitored filer.
Overall Activity of a NetApp Filer The overall activity can also be reported in GB per hour or per day (instead of MB/s) so SAN administrators can visualize how much data has been written to or read off the disk array each hour of the day or each day of the week (see the Reporting the total traffic on an hourly or daily basis section for more information on this subject). See also
|