Use Cases
This section describes the following EMC XtremIO monitoring use cases:
- Diagnosing a bad physical disk layout
- Diagnosing slow volumes
- Reclaiming space of unused volumes.
Diagnosing a Bad Physical Disk Layout
A non-optimal physical disk layout can cause one single physical disk to become the bottleneck of a SAN. To verify that the amount of data being read/written on a physical disk is well-balanced over time across all physical disks, you need to compare the throughput of read/write data for each physical disk in your EMC XtremIO storage systems.
To compare the I/Os of physical disks, you will need to create a dashboard. Dashboards allow you to gather specific types of data and display them in a consolidated graphical format. For detailed information about dashboards options and features, refer to the BMC documentation.
- Log on to the TrueSight console
- Select Dashboards from the navigation pane
- In the Dashboards page, click Add Dashboard or select Add Dashboard from the dashboard action menu

- Enter a Title for your dashboard and configure a Global Filter, if needed
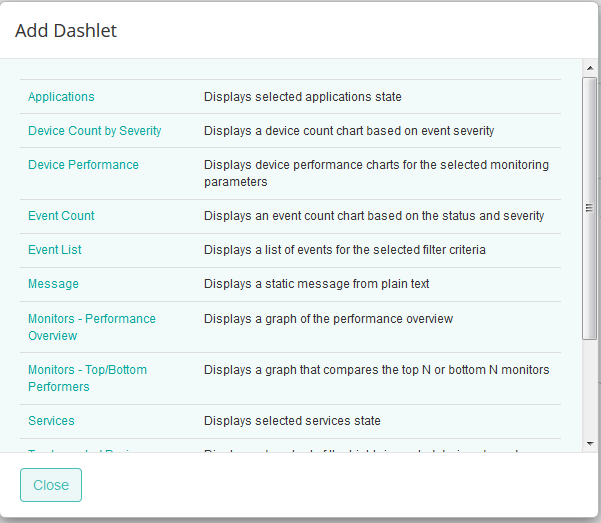
- Click Add Dashlet to open the dashlet library for the first column of the row
- From the dashlet library, select the Device Performance template, and then click Close
-
Select Configure Dashlet by clicking the
 button
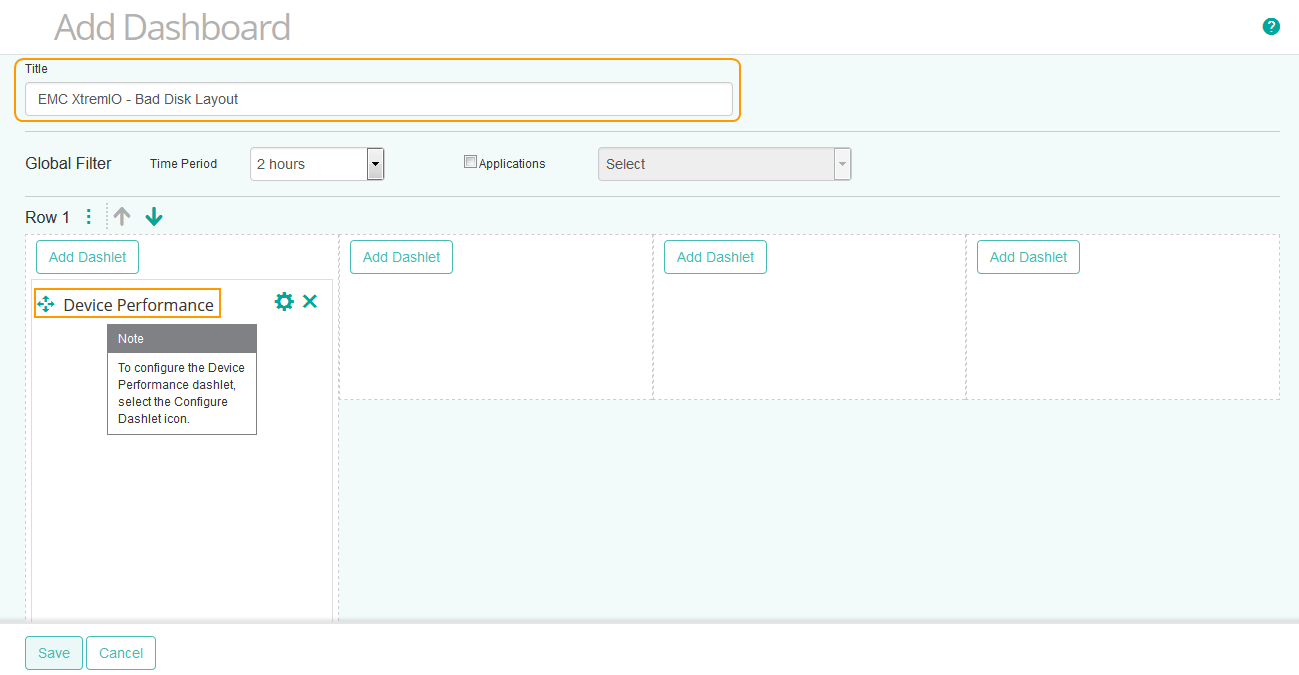
-
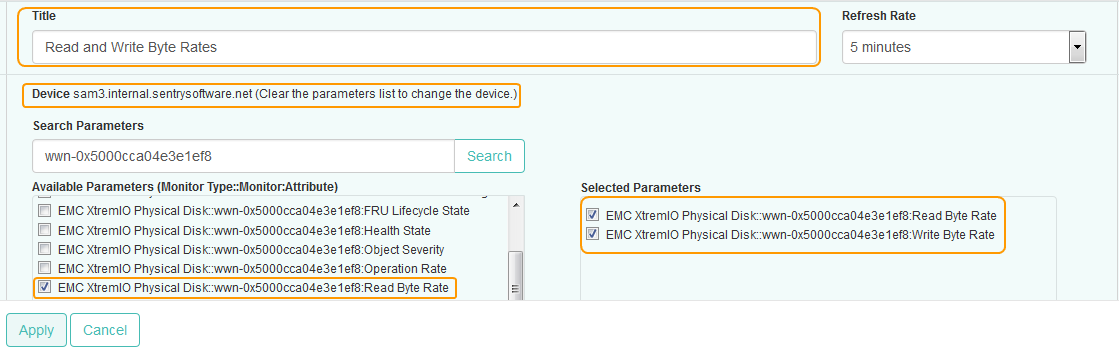
In the panel of input fields and options that opens below the dashboard, enter a Title for the dashlet and specify a Refresh Rate (default is 5 minutes)
- Select the EMC XtremIO storage device for which you need to compare physical disks I/Os
- Select the Read Byte Rate and Write Byte Rate parameters for the first physical disk, and click Apply
-
Repeat this operation in the next column(s) of the dashboard with other physical disks and click Save
- The dashboard is completed and shows the Read Byte Rate and Write Byte Rate parameters for the selected physical disks
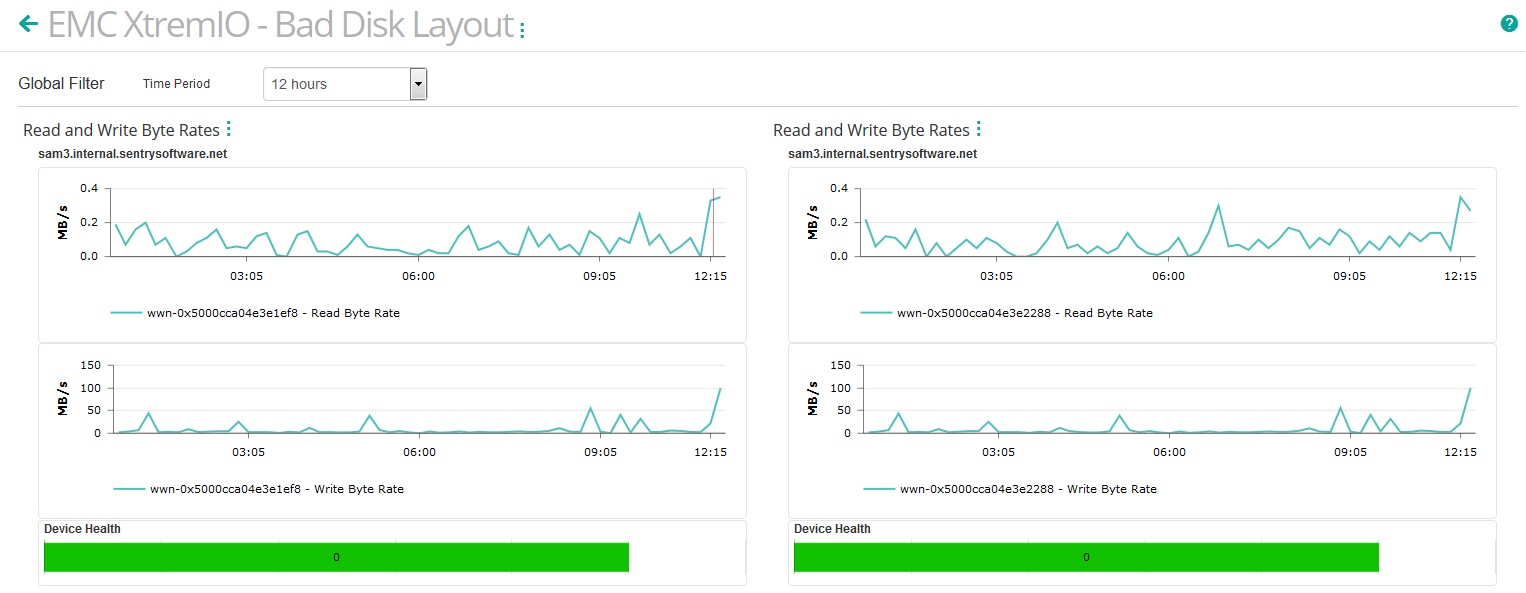
-
Verify that the Read Byte Rate and Write Byte Rate parameters of all the physical disks have similar average values to ensure that I/Os are well-balanced across all physical disks.
Diagnosing Slow Volumes
When servers are experiencing slow I/Os performance, you may want to verify the actual response time of the volumes the server is relying on. The response time represents the average time it takes to complete the read/write operations on a volume during the collection interval. Typically, the average response time is below 10 milliseconds. You may also want to compare this value with other volumes response time to find out if they have relatively similar throughput or if one server is really getting worse I/O performance than another.
The industry common guidelines in terms of response time are:
| Response Time | Performance |
|---|---|
| Less than 10 ms | Very good |
| Between 10 – 20 ms | OK |
| Between 20 – 50 ms | Slow, needs attention |
| Greater than 50 ms | I/O bottleneck |
To identify slow volumes, you will need to create a simple dashboard. Dashboards allow you to gather specific types of data and display them in a consolidated graphical format. For detailed information about dashboards options and features, refer to the BMC documentation.
To diagnose slow volumes:
- Log on to the TrueSight console
- Select Dashboards from the navigation pane
- In the Dashboards page, click Add Dashboard or select Add Dashboard from the dashboard action menu
- Enter a Title for your dashboard and configure a Global Filter, if needed
- Click Add Dashlet to open the dashlet library for the first column of the row
- From the dashlet library, select the Device Performance template, and then click Close
-
Select Configure Dashlet by clicking the
button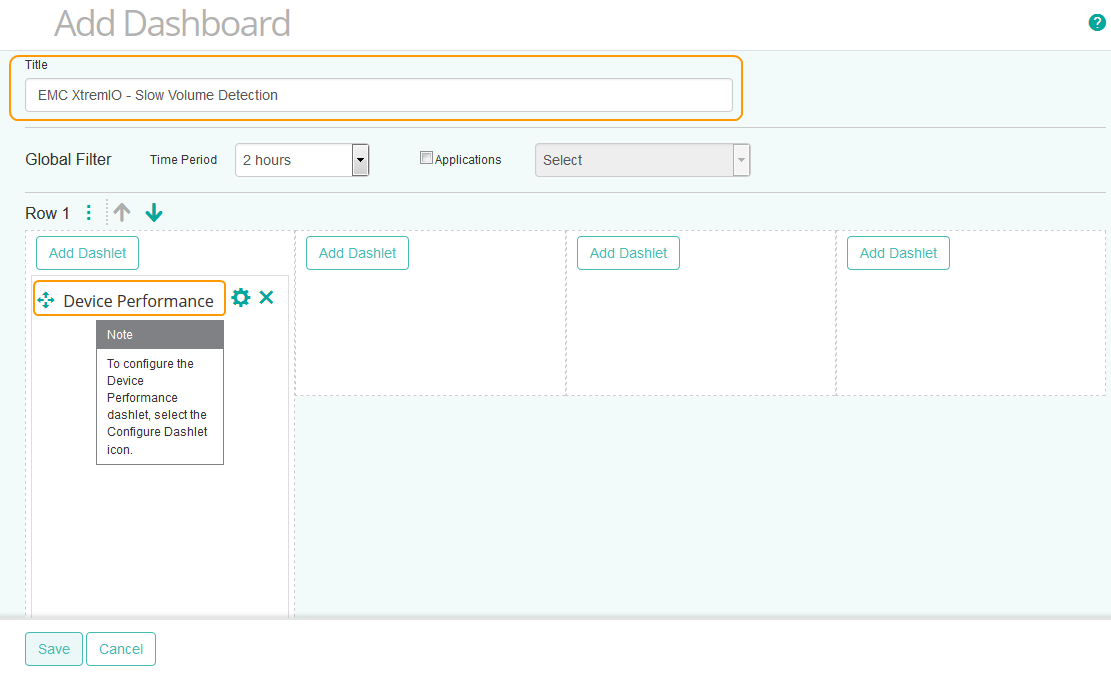
-
In the panel of input fields and options that opens below the dashboard, enter a Title for the dashlet and specify a Refresh Rate (default is 5 minutes)
- Select the EMC XtremIO device for which you need to compare volumes response times
- Select the Response Time parameter for the first volume, and click Apply
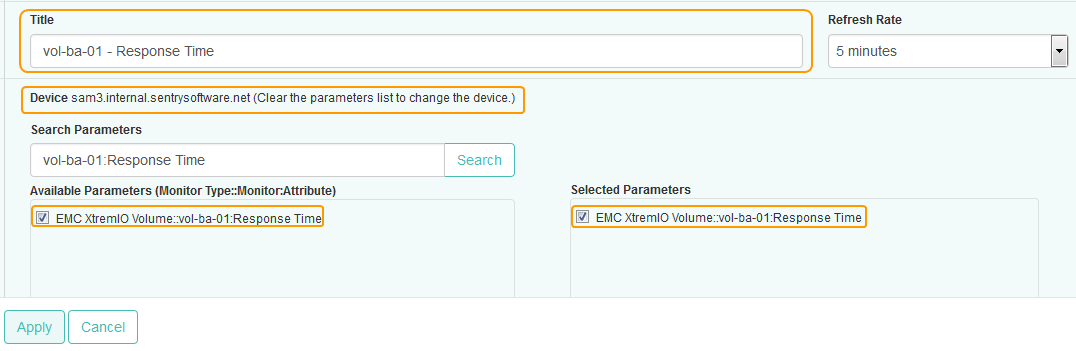
-
Repeat this operation in the next columns of the dashboard for other volumes and click Save
- The dashboard is completed and shows the Response Time for all the selected volumes
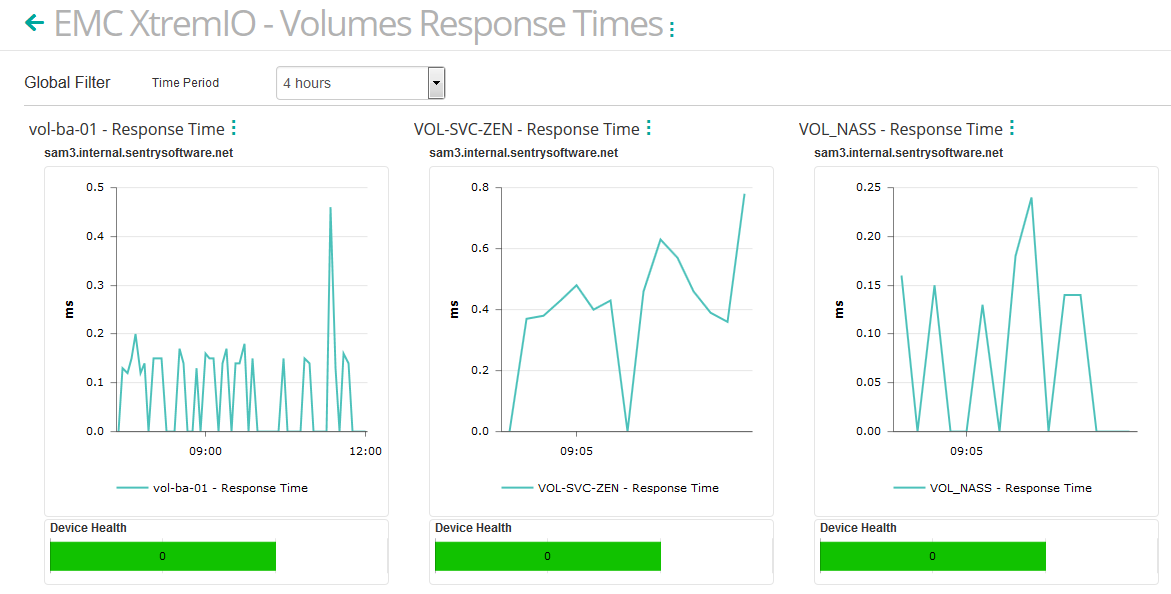
If the response time is high, you will need to check the amount of data that is written and read on this volume. The bad performance may simply be due to an abnormally large amount of data to process.
Reclaiming Space of Unused Volumes
Over time, as servers connected to a SAN get decommissioned, you may find an increasing number of volumes that are no longer used by any server. These LUNs, while unused, still occupy disk space in the disk array. Being able to identify such volumes and reclaim the disk space uselessly consumed by these devices will help you avoid unnecessary upgrades and extensions of your devices.
To reclaim space of unused volumes:
- Log on to the TrueSight console
- Select Dashboards from the navigation pane
- In the Dashboards page, click Add Dashboard or select Add Dashboard from the dashboard action menu
- Enter a Title for your dashboard and configure a Global Filter, if needed
- Click Add Dashlet to open the dashlet library for the first column of the row
- From the dashlet library, select the Monitors - Top/Bottom Performers template, and then click Close
-
Select Configure Dashlet by clicking the
button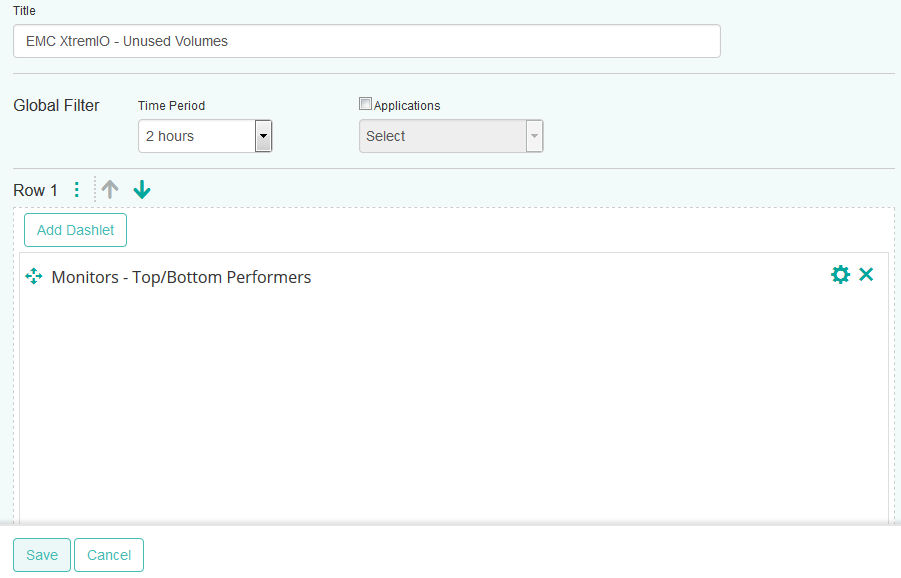
-
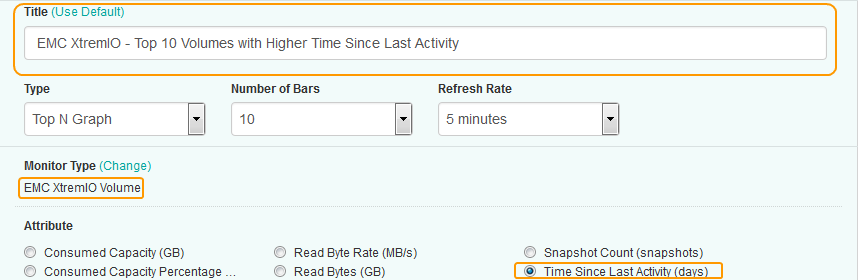
In the panel of input fields and options that opens below the dashboard, enter a Title for the dashlet and specify a Refresh Rate (default is 5 minutes).
- Select the Monitor Type for which you want to create a graph.
- Configure the graph parameters:
- In the Type field, select Top N Graph
- In the Number of Bars field, select the number of volumes for which you need to compare activity (default is 10).
-
Set the Refresh Rate.
- Select the Time Since Last Activity parameter, and click Apply.
-
The dashboard is completed and shows the top x volumes with the higher number of days of inactivity. Pass the mouse over a bar to view the average, high and low values for a volume.
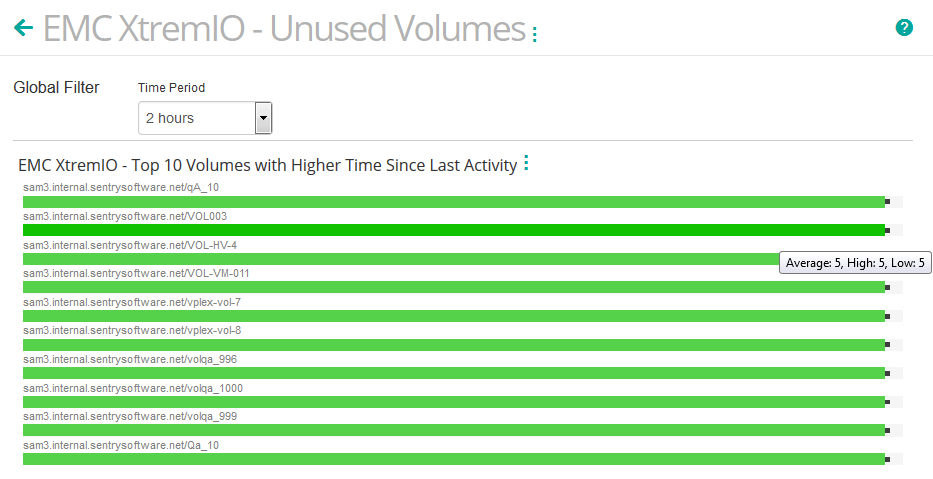
Storage space in volumes with a high Time Since Last Activity value can be reclaimed. The freed storage space is then available for other file systems created in a given storage pool.
xtremio km patrol