|
Making sure that a storage system has enough remaining disk space available is critical for several reasons:
| • | SAN administrators want to make sure to be able to provision disk space for new servers when requested, as quickly as possible. |
| • | The storage system itself may need additional disk space for specific features to work properly, like automatic snapshots, mirroring, etc. |
| • | If thin provisioning is used, the remaining disk space becomes dramatically critical since the inability to allocate additional space to a volume when requested by the subscriber host will lead to catastrophic data loss and corruption. |
The disk space used is permanently monitored for each storage pool. The Subscribed Capacity parameter of a storage pool represents the amount of disk space that has been made available to the subscriber hosts, or in other words, the amount of disk space that is seen by the servers connected to the storage system.
The Consumed Capacity parameter of a storage pool represents the actual space usage in the storage pool. For “thin” pools (when thin provisioning is enabled on the storage system), this value is normally lower than the Subscribed Capacity, as it is the main purpose of thin provisioning. For traditional pools, the Consumed Capacity has the same value as the Subscribed Capacity, as the entirety of the subscribed disk space is fully allocated in the storage pool.
The Consumed Capacity Percentage parameter is the most critical one, even for non-thin storage pools, as a storage pool usage nearing 100% means that SAN administrators will not be able to create new volumes in the storage pool. By default, no alarm or warning threshold is set on this parameter as the fullness of a storage pool may be a normal situation.
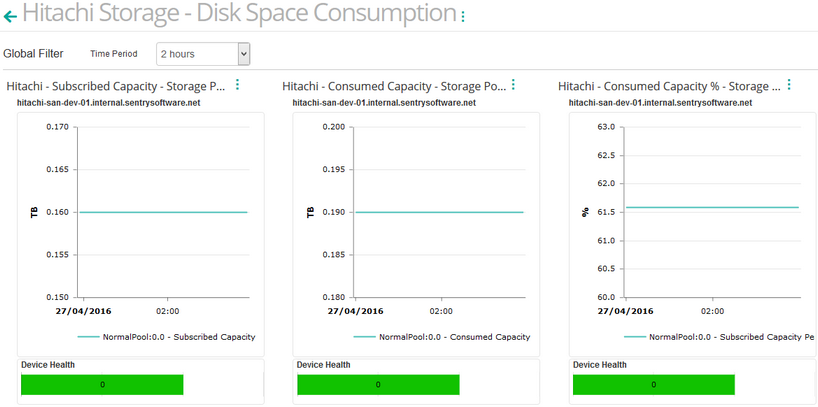
To determine the actual disk space consumption for a storage system, you will need to create a simple three-column dashboard. Dashboards allow you to gather specific types of data and display them in a consolidated graphical format. For detailed information about dashboards options and features, refer to the BMC documentation.
To Report on Disk Space Consumption
| 1. | Login to your BMC TrueSight Operations Management console. |
| 2. | Select Dashboards from the navigation pane. |
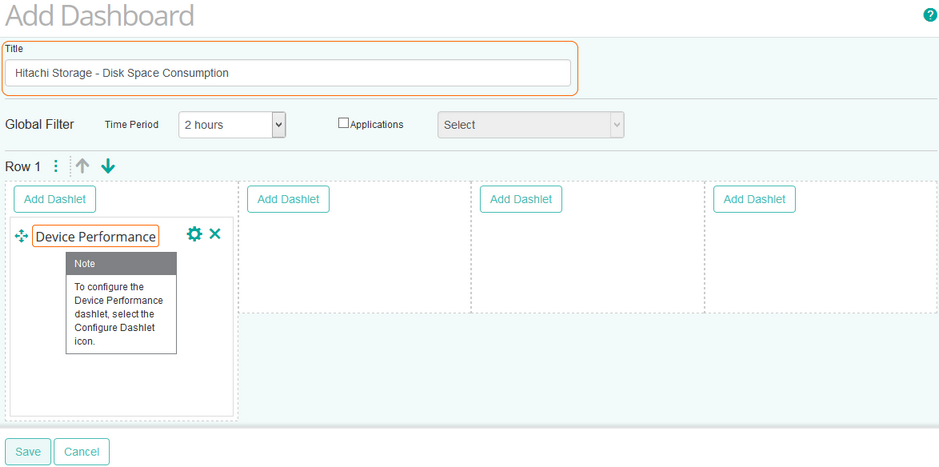
| 3. | In the Dashboards page, click Add Dashboard or select Add Dashboard from the dashboard action menu  . . |

| 4. | Enter a Title for your dashboard and configure a Global Filter, if needed. |
| 5. | Click Add Dashlet to open the dashlet library for the first column of the row. |
| 6. | From the dashlet library, select the Device Performance template, and then click Close. |

| 7. | Select Configure Dashlet by clicking the  button. button. |
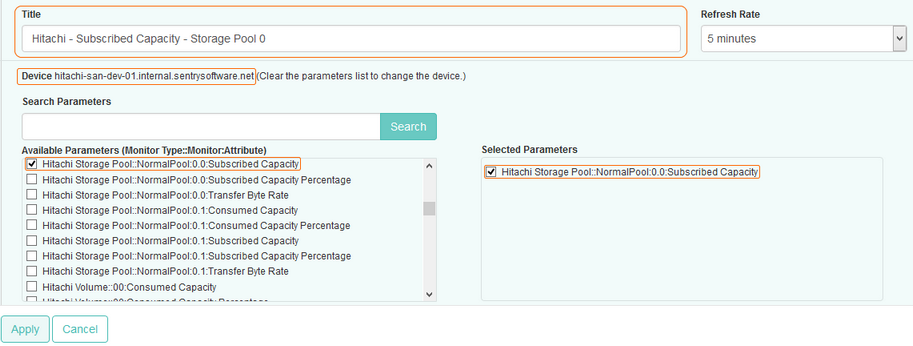
| 8. | In the panel of input fields and options that opens below the dashboard, enter a Title for the dashlet and specify a Refresh Rate (default is 5 minutes). |
| 9. | Select the Hitachi storage device for which you want to compare processors utilization. |
| 10. | Select the Subscribed Capacity parameter for a storage pool, and click Apply. |

Tip
To quickly retrieve a component or a parameter, enter its name in the Search Parameters field and click Search.
|
| 11. | Repeat this operation in the next column of the dashboard for the Consumed Capacity parameter and click Apply. |
| 12. | Finally, in the third column of the dashboard, select the Consumed Capacity Percentage parameter and click Save. |
| 13. | The dashboard is completed and shows the disk space consumption for the selected storage pools. |

See also
Monitoring your Storage Environment
Creating Consolidated Data Views with Dashboards
Hitachi Storage Pool
|


