|
The cache efficiency is monitored at each level of the storage subsystem: each controller, logical drive and overall subsystem. The Cache Hit Ratio attribute represents the percentage of data blocks that were successfully served by the cache without directly interrogating the physical layer. Values in the lower range indicate that the cache size is probably not large enough to properly optimize the data flow in the SAN.
Evaluating the caching efficiency for a specific subsystem
| 1. | Log on to the BMC ProactiveNet Operations Console. |
| 2. | Display the list of devices monitored by BPPM: |
| • | In the Navigation frame, select the Main drawer. |
| • | Click  to display the list of devices in a grid. to display the list of devices in a grid. |
| 3. | Click the subsystem of the logical drives for which you need to verify the caching mechanism. |
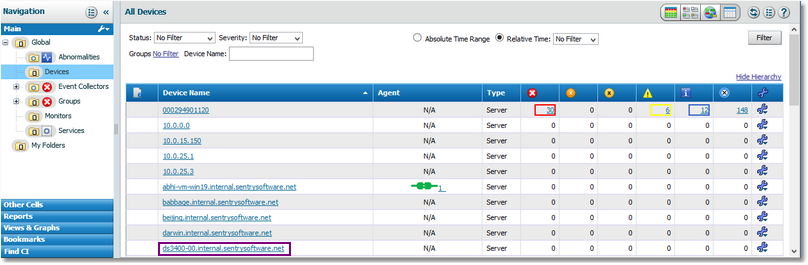
Selecting a Device
| 4. | The list of monitors for your device is displayed. Identify the logical drive for which you need to evaluate the efficiency of the caching mechanism. |
| 5. | Click  for the chosen logical drive. for the chosen logical drive. |
| 6. | By default, only the Transfer Byte Rate attributes is displayed. You will need to modify the attributes selection to display the ones you need: |
| • | Click the Attributes & Indicators tab. |
| • | Deselect the Transfer Byte Rate attribute and select the Cache Hit Ratio attribute instead. |
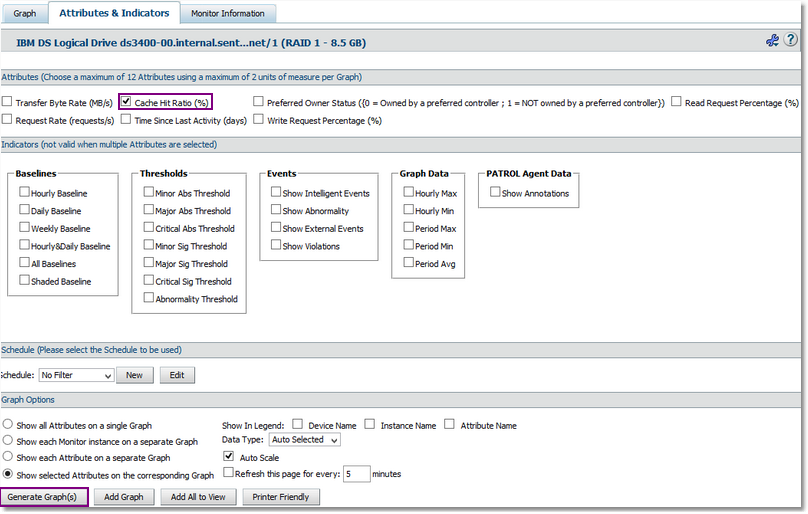
Selecting the Attributes to Display in the Graph
| 7. | Add the graph to the view: |
| • | Click  . The following pop-up is displayed: . The following pop-up is displayed: |
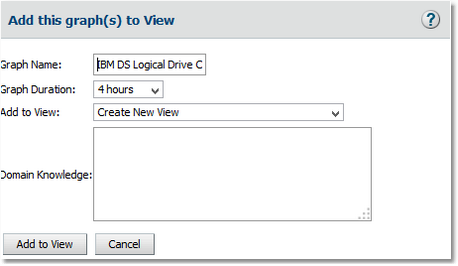
Adding a Graph to View - Step 1
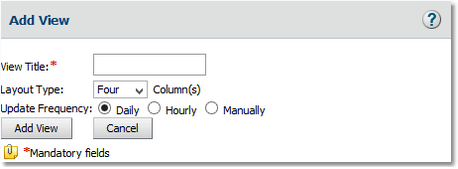
Adding a Graph to View - Step 2
| • | In the View Title field, type Logical Drive Caching Efficiency and click Add View. The View created successfully message appears. Click Close. |
| 8. | The Logical Drive Caching Efficiency view is now created and available under the Views & Graphs drawer in the Navigation pane. |
| 

