|
In order to visualize the activity of a subsystem, use the Transfer Byte Rate attribute of the IBM DS345 Disk Array monitor type. This attribute represents the overall traffic in megabytes per second for each monitored array, or more precisely, each IBM subsystem that is exposed through the SMcli utility (see the Prerequisites chapter for more information about the IBM System Storage DS Storage Manager and SMcli utility).
Verifying a subsystem activity
| 1. | Log on to the BMC ProactiveNet Operations Console. |
| 2. | Display the list of devices monitored by BPPM: |
| • | In the Navigation frame, select the Main drawer. |
| • | Click  to display the list of devices in a grid. to display the list of devices in a grid. |
| 3. | Click the first subsystem for which you need to compare the physical disks utilization. |
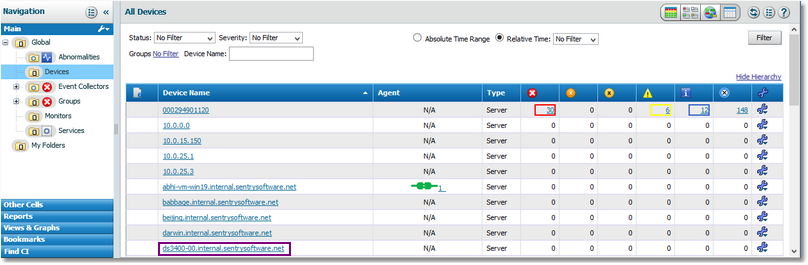
Selecting a Device
| 4. | The list of monitors for your device is displayed. Select the disk array for which you need to get an overall activity view. |
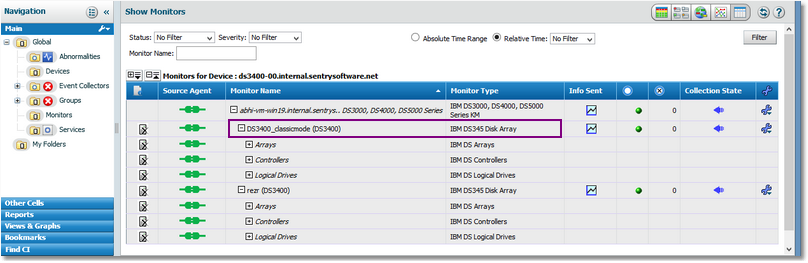
Displaying the Monitors
| 5. | Click  for the chosen disk array. for the chosen disk array. |
| 6. | By default, the Available Capacity and Transfer Byte Rate attributes are displayed. You will need to modify the attributes selection to display the ones you need: |
| • | Click the Attributes & Indicators tab. |
| • | Deselect the Available Capacity attribute and keep the Transfer Byte Rate attribute checked. |
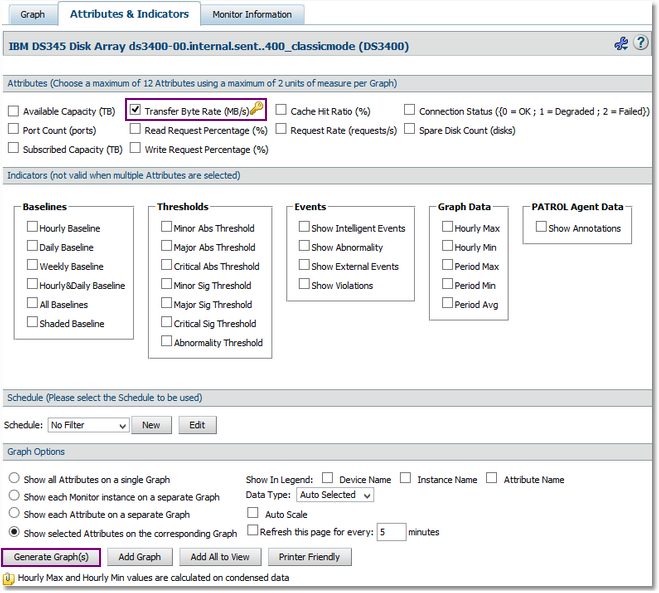
Selecting the Attributes to Display in the Graph
| 7. | Add the graph to the view: |
| • | Click  . The following pop-up is displayed: . The following pop-up is displayed: |
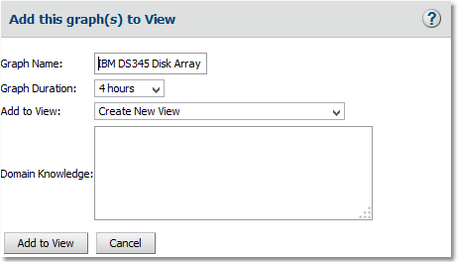
Adding a Graph to View - Step 1
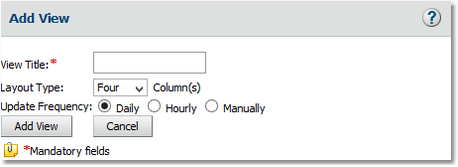
Adding a Graph to View - Step 2
| • | In the View Title field, type Subsystem Overall Activity and click Add View. The View created successfully message appears. Click Close. |
| 8. | The Subsystem Overall Activity view is now created and available under the Views & Graphs drawer in the Navigation pane. |
|


