-
Home
- Integrations Prometheus 3
Consuming Prometheus Metrics in Monitoring Studio X
Sentry Software has developed a monitoring template to allow you to consume the metrics exposed by any Prometheus exporter in Monitoring Studio X and BMC TrueSight/Helix. This template, named prometheusExporterTemplate.cfg, is available for free on GitHub.
About the Prometheus Exporter Template
The template consists of:
-
an HTTP request that queries the Prometheus URL
/metricsusing theGETmethod -
five Dynamic Objects to sort the extracted data by Bytes, Fractions, Hertz / MHz, Seconds, and Other metrics. Each Dynamic Object specifies how to:
- find the required information in
/metrics - convert units to comply with PATROL usage (when required).
- find the required information in
In the sections below, we will review each Dynamic Object so you can better understand how they are configured to consume Prometheus metrics and be able to customize them or create your own later.
Bytes Metrics (Converted to MB)
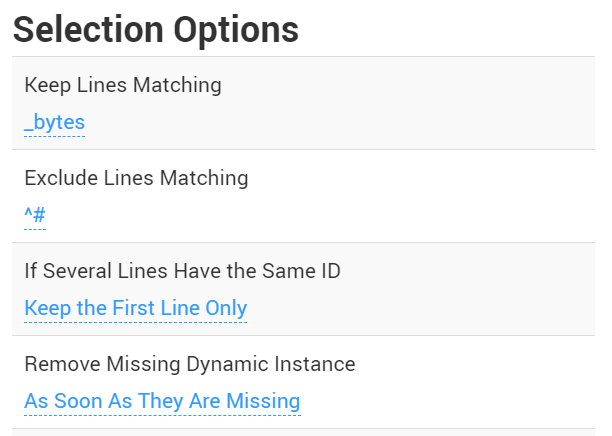
The Bytes Metrics (Converted to MB) Dynamic Object:
-
searches for all lines that contain the _bytes string
-
excludes comments (lines matching the ^# expression)
-
Keeps the first line only
-
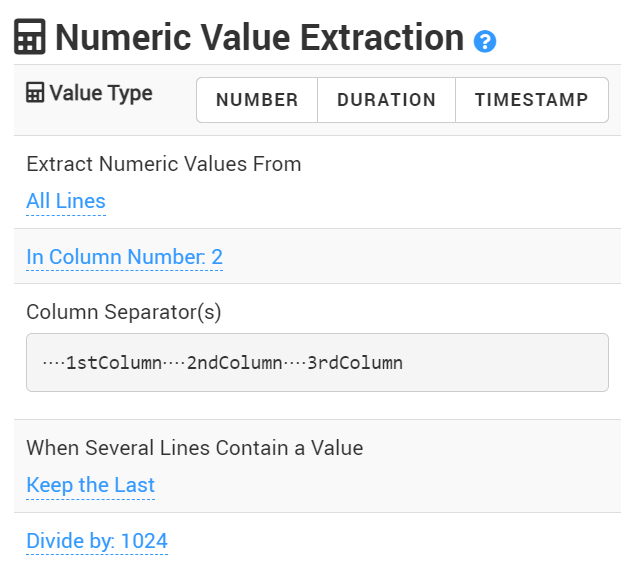
converts Bytes metrics to MegaBytes to ensure values remain in an acceptable range for a PATROL parameter using a Numeric Value Extraction Monitor. This Monitor divides the extracted metric by 1024:
Fraction Metrics
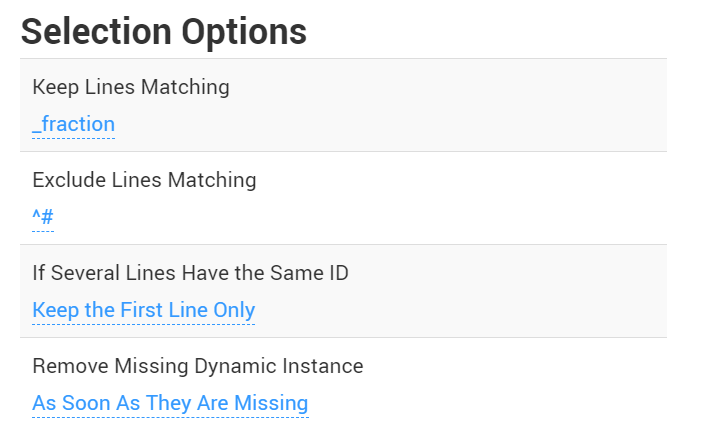
The Fraction Metrics Dynamic Object:
-
searches for all lines that contain the _fraction string
-
excludes comments (lines matching the ^# expression)
-
keeps the first result found if several lines have the same ID
-
provides the information with a Numeric Value Extraction Monitor named Value.
Hertz / MHz Metrics
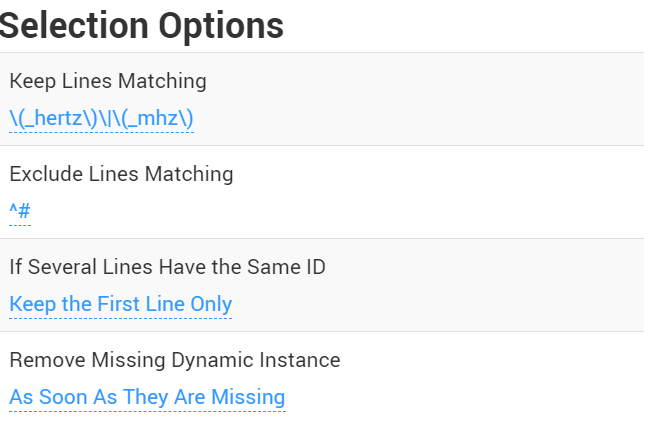
The Hertz / MHz Metrics Dynamic Object:
-
searches for all lines that contain the hertz and mhz strings
-
excludes comments (lines matching the ^# expression)
-
keeps the first result found if several lines have the same ID
-
provides the information with the Numeric Value Extraction Monitor named Value.
Seconds Metrics
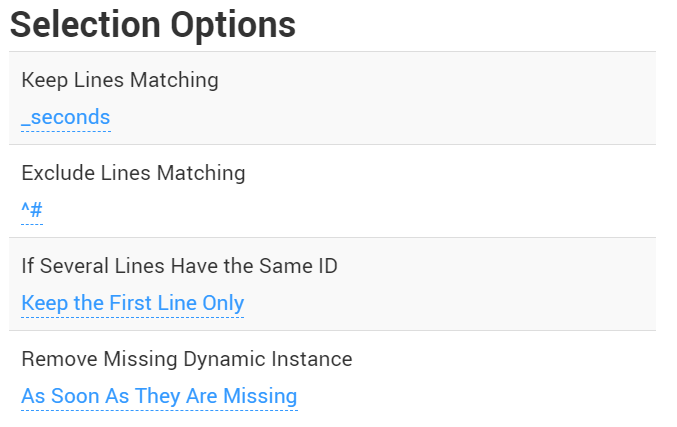
The Seconds Metrics Dynamic Object:
-
searches for all lines that contain the _seconds string
-
excludes comments (lines matching the ^# expression)
-
keeps the first result found if several lines have the same ID
-
provides the information with the Numeric Value Extraction Monitor named Value.
Other Metrics
The Other Metrics Dynamic Object extract any Prometheus metric whose units is not Bytes, Fractions, Hertz / MHz, and Seconds. It is configured as follows:
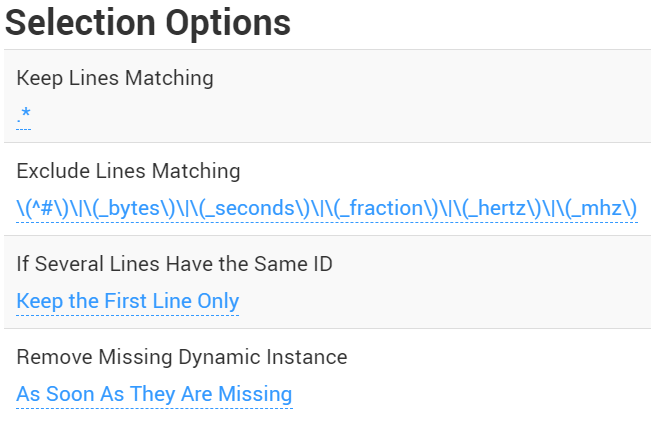
The information is displayed with the Numeric Value Extraction Monitor named Value.
Using prometheusExporterTemplate.cfg
Prerequisites
Before configuring Monitoring Studio X to consume Prometheus metrics, make sure that:
- Prometheus and all the required exporters are properly installed and configured
- you have the latest version of the
prometheusExporterTemplate.cfgfile at hand. If not, download it from GitHub.
Configuring the Template
-
Import the
prometheusExporterTemplate.cfgfile in Monitoring Studio X:- Log in to the Monitoring Studio X Web interface
- Click the Studio menu
- In the Monitoring Templates section, click Import Template. Locate and select the
prometheusExporterTemplate.cfgfile you previously downloaded - Click Open.
-
In the Monitoring Templates list, click Prometheus Exporter %{EXPORTER_NAME}
-
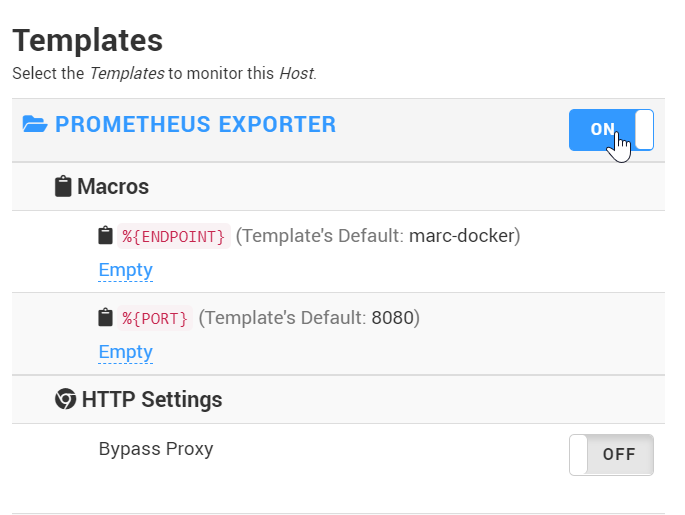
Set the value of the following macros:
- %{ENDPOINT}: hostname of the machine where the Prometheus exporter is running
- %{PORT}: port on which the Prometheus exporter is running
-
From the Studio page, click the host on which you wish to enable the template and enable Prometheus Exporter.
-
Repeat the procedure for each Prometheus exporter for which you wish to consume metrics in Monitoring Studio X.
Customizing the Template
Once the prometheusExporterTemplate.cfg file has been imported and configured in Monitoring Studio X, you can:
- set thresholds for the default Monitors. Refer to Alert Messages and Actions for more details.
- create new Monitors to display other Prometheus metrics in Monitoring Studio X. Refer to the Working With Monitors chapter or the examples below for more details.
When you are done customizing the template, click the Studio page to access the extracted data.
Example
In this example, we assume that the monitored Prometheus exporter reports the number of failures and you wish to be informed when a new failure is detected.
First, Create a Dynamic Object with the following settings:
| Setting | Value |
|---|---|
| Dynamic Instance Internal ID | %{1} |
| Dynamic Instance Display Name | %{1} |
| Column Separators | |
| Display Name | Failures |
| Keep Lines Matching | _failures |
| Exclude Lines Matching | ^# |
All other settings should be left to their default value.
This will create a Dynamic Object for each failure metric returned by the monitored Prometheus exporter.
Then, under the Dynamic Object, add a Numeric Value Extraction Monitor with the following settings:
| Option | Value |
|---|---|
| Value Type | Number |
| Extract Numeric Values | |
| Column Separators | |
| Parameters and Alerts | Delta: On / All other parameters: Off |
| Delta Thresholds | Alarm When value >= 1, immediately |
All other settings should be left to their default value.
This will extract the number of failures from the Prometheus metric. Assuming this metric is a counter (a cumulative metric), the Delta parameter will calculate the difference between each polling and trigger an alert if new failures are detected.