-
Home
- Configuration
OpenTelemetry Advanced Settings
Hardware Sentry comes with a default configuration file (otel/otel-config-example.yaml) which is intended to work for most situations and only requires minor changes for Hardware Sentry to operate properly (refer to the Integration pages for more information).
This page is therefore intended for advanced users who have a deep knowledge of OpenTelemetry and wish to learn more about the properties available in
otel/otel-config.yaml.
Important: We recommend using an editor supporting the Schemastore to edit Hardware Sentry's configuration YAML files (Example: Visual Studio Code and vscode.dev, with RedHat's YAML extension).
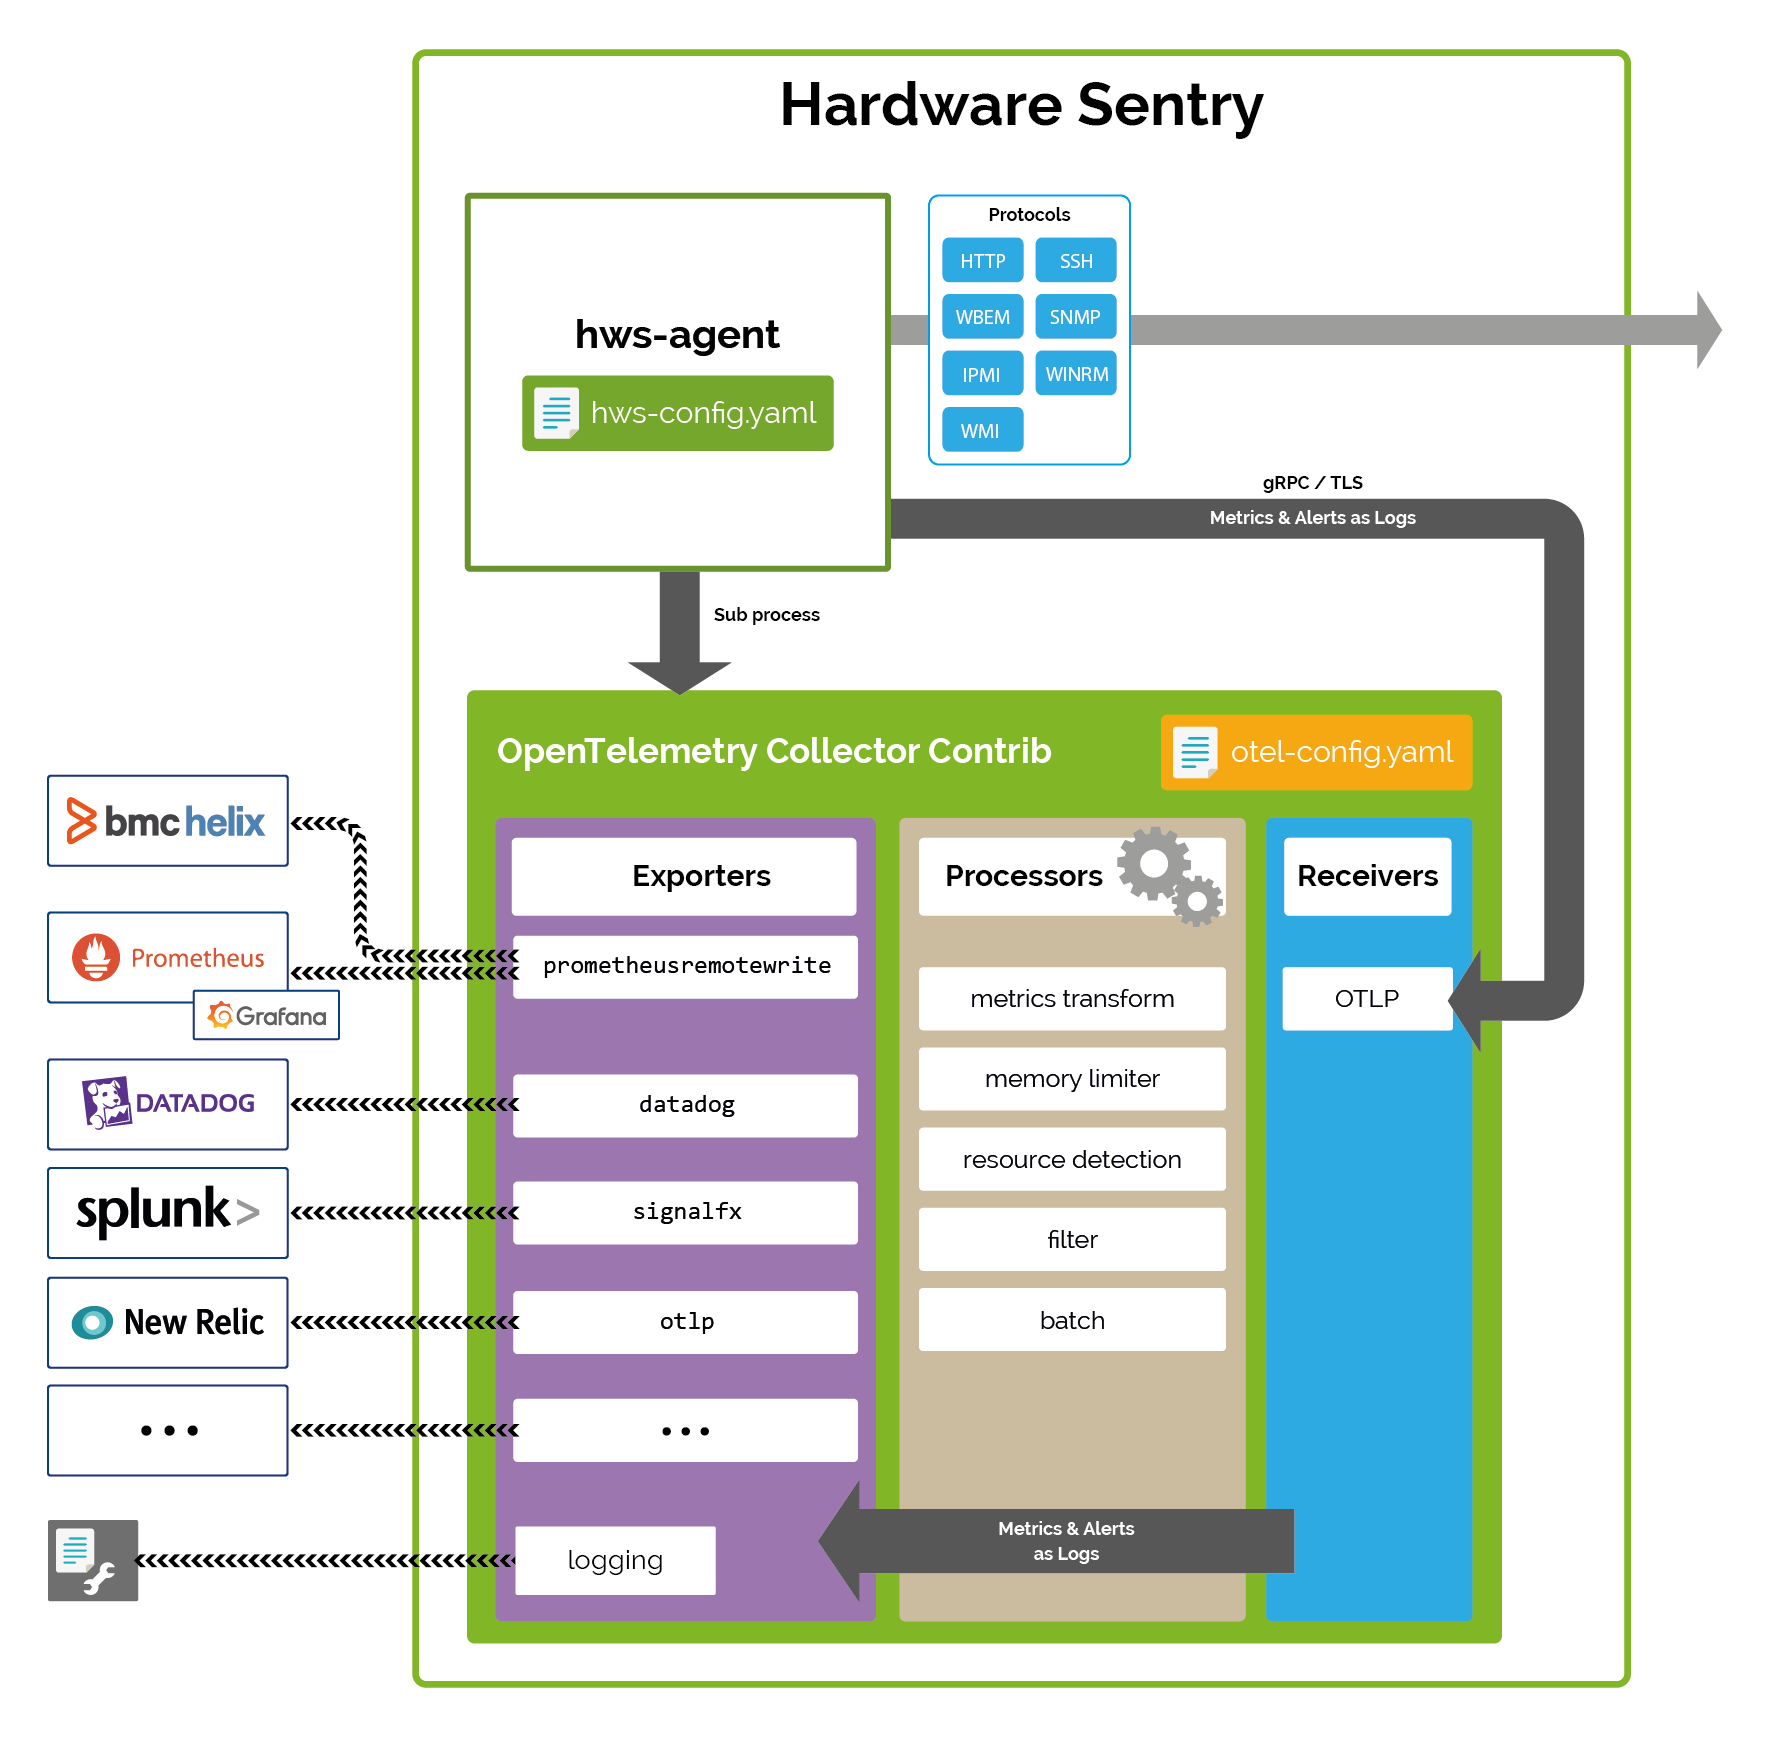
As a regular OpenTelemetry Collector, Hardware Sentry consists of:
- receivers
- processors
- exporters
- and several extensions.

This version of Hardware Sentry leverages version 0.67.0 of OpenTelemetry.
Receivers
OTLP gRPC
Warning: Only update this section if you customized the Hardware Sentry Agent settings. The Hardware Sentry Agent pushes the collected data to the
OTLP Receivervia gRPC on port TCP/4317.
The OTLP Receiver is configured by default with the self-signed certificate security/otel.crt and the private key security/otel.key to enable the TLS protocol. If you wish to set your own certificate file, configure the Hardware Sentry Agent with the correct Trusted Certificates File. Because the OTLP Exporter of the Hardware Sentry Agent performs hostname verification, you will also have to add the localhost entry (DNS:localhost,IP:127.0.0.1) to the Subject Alternative Name (SAN) extension of the new generated certificate.
Clients requests are authenticated with the Basic Authenticator extension.
  otlp:
    protocols:
      grpc:
        endpoint: localhost:4317
        tls:
          cert_file: ../security/otel.crt
          key_file: ../security/otel.key
        auth:
          authenticator: basicauth
OpenTelemetry Collector Internal Exporter for Prometheus
The OpenTelemetry Collector's internal Exporter for Prometheus is an optional source of data. It provides information about the collector activity (see Health Check). It's referred to as prometheus/internal in the pipeline and leverages the standard prometheus receiver.
  prometheus/internal:
    config:
      scrape_configs:
        - job_name: otel-collector-internal
          scrape_interval: 60s
          static_configs:
            - targets: [ localhost:8888 ]
Under the service:telemetry:metrics section, you can set the metrics level or the address of the OpenTelemetry Collector Internal Exporter (by default: localhost:8888).
service:
  telemetry:
    metrics:
      address: localhost:8888
      level: basic
Processors
By default, the collected metrics go through 5 processors:
metricstransformto enrich the collected metrics, typically with labels required by the observability platforms. Themetricstransformprocessor has many options to add, rename, delete labels and metrics. Note that Hardware Sentry Agent can also be configured to enrich the collected metrics with extra labels.memory_limiterto limit the memory consumed by the OpenTelemetry Collector process (configurable)resourcedetectionto find out the actual host name of the system monitoredfilterto include or exclude metricsbatchto process data in batches of 10 seconds (configurable).
Exporters
The exporters section defines the destination of the collected metrics. Hardware Sentry version 3.1.02 includes support for all the OpenTelemetry Collector Contrib exporters, such as:
- OLTP/gRPC Exporter
- Prometheus Remote Write Exporter
- Prometheus Exporter
- Datadog Exporter
- Logging Exporter
- Splunk SignalFx Exporter
- Dynatrace Exporter
- Instana Exporter
- and many more…
You can configure several exporters in the same instance of the OpenTelemetry Collector to send the collected metrics to multiple platforms.
Use the above links to learn how to configure these exporters. Specific integration scenarios are also described for:
Extensions
HealthCheck
The healthcheck extension checks the status of Hardware Sentry . It is activated by default and runs on port 13133 (http://localhost:13133).
Refer to Check the collector is up and running for more details.
zpages
The zpages extension provides debug information about all the different components. It notably provides:
- general information about Hardware Sentry
- details about the active pipeline
- activity details of each receiver and exporter configured in the pipeline.
Refer to Check the pipelines status for more details.
Basic Authenticator
The Basic Authenticator extension authenticates the OTLP Exporter requests by comparing the Authorization header sent by the OTLP Exporter and the credentials provided in the security/.htpasswd file. Refer to the Apache htpasswd documentation to know how to manage user files for basic authentication.
  basicauth:
    htpasswd:
      file: ../security/.htpasswd
The .htpasswd file is stored in the security directory.
Warning: If a different password is specified in the
.htpasswdfile, update the Basic Authentication Header of the Hardware Sentry Agent.
The Pipeline
Configured extensions, receivers, processors and exporters are taken into account if and only if they are declared in the pipeline:
service:
  telemetry:
    logs:
      level: info # Change to debug for more details
    metrics:
      address: localhost:8888
      level: basic
  extensions: [health_check, basicauth]
  pipelines:
    metrics:
      receivers: [otlp, prometheus/internal]
      processors: [memory_limiter, batch, resourcedetection, metricstransform]
      exporters: [prometheusremotewrite/your-server] # List here the platform of your choice

    # Uncomment the section below to enable logging of hardware alerts.
    # logs:
    #   receivers: [otlp]
    #   processors: [memory_limiter, batch, resourcedetection]
    #   exporters: [logging] # List here the platform of your choice