-
Home
- TrueSight
Configure CMA Policies
This section explains the settings required to configure Veritas Cluster Server KM via a TrueSight/Helix CMA policy.
Configuring After Installation
Once Veritas Cluster Server KM is installed, you will have to configure the Veritas Cluster Server KM Monitor Types through policies. Policies enable you to deploy configurations on PATROL Agents and monitoring solutions, such as Veritas Cluster Server KM in an automated way. Policies are designed to define and configure monitoring criteria and apply them to the specified PATROL Agents. The configuration criteria are automatically pushed to the PATROL Agents on which the policy is applied. When a monitoring policy is applied to a PATROL Agent, the device is automatically added to the list of monitored devices.
To create a monitoring policy:
- Log on to the TrueSight console.
- In the navigation pane, expand Configuration and select Infrastructure Policies.
- In the Infrastructure Policies page, ensure that the Monitoring tab is selected and click Create Policy.
- In the Create Monitoring Policy page, specify the monitoring policy properties:
Step 1 - Define the General Properties
Property Description Name Name for the policy. The policy names must be unique. In an environment with tenants, the policy names must be unique for a single tenant. It is a mandatory field. Description (Optional) A brief description about the policy. Associated User Group Name of the user group that is associated with the PATROL Agents as defined in the Authorization Profile or in the PATROL Agent ACLs. The policy is applicable to these PATROL Agents. Share with User Group Specify whether this policy is to be shared with the users across the associated user group or not. This property can be viewed in READ-ONLY mode by other users of the associated user group. Only the owner of the policy can modify this property. Precedence Priority of the policy. Based on the precedence number that you configure, the configuration is applied to the PATROL Agents and the Infrastructure Management servers. The precedence number ranges from 0 to 999. A lower number indicates a higher precedence. The default value is 900. The configuration from a policy with a higher precedence overrides the configuration from a policy with a lower precedence. If two policies have the same precedence number, then the configuration from the latest created policy takes priority. Enable Policy Indicates whether the policy is enabled or disabled. By default, the policy is disabled. If you do not enable a policy when you create it, the policy configurations are not applied to the PATROL Agents and the Infrastructure Management Servers. If you disable any existing policy, the policy configurations are removed from the PATROL Agents and the Infrastructure Management servers, where the policy was applied. Step 2 - Select the PATROL Agents
Define conditions to select the PATROL Agents on which you want to apply the policy:
- Select a property.
- Select an operator to create the condition. The available operators depend on the property that you select.
- Specify a value for the selected property.
- (Optional) To add more than one condition, click the

- (Optional) To group the conditions, use the parentheses and Boolean operators from their corresponding lists.
The Add Monitor Types dialog box presents configuration fields for compatible BMC PATROL monitoring solutions that are located in the Central Monitoring Repository.
Step 3 - Select the Required Monitor Type
- Click the Monitoring tab.
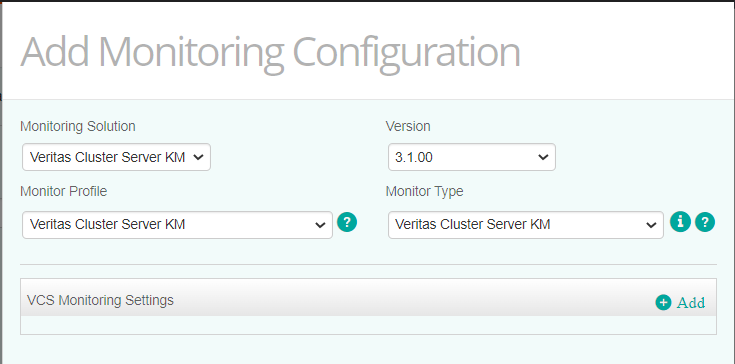
- Click Add Monitoring Configuration.
- In the Add Monitoring Configuration dialog box, configure the properties:
- From the Monitoring Solution menu, select Veritas Cluster Server KM.
- From the Version menu, select the required version.
The Monitor Profile Veritas Cluster Server KM is automatically selected.
Refer to the table below to know which monitor types are available and their function:
Monitor Type Description Veritas Cluster Server KM (REQUIRED) To set the general settings of the Veritas Cluster Server monitoring solution (credentials, debug mode, instances, multi-node mode, etc.). Once this monitor type is configured, all other monitor types are automatically monitored. Their default behavior can however be modified by selecting them from the Monitor Type list. No other monitor types can be configured as long as Veritas Cluster Server KM is not configured. VCS Agent To modify the agent default monitoring. VCS Daemon To modify the daemon default monitoring. VCS GAB Port To modify the GAB port default monitoring. VCS Group System To modify the group system default monitoring. VCS LLT Interface To modify the LLT interface default monitoring. VCS Log To modify the log default monitoring. VCS Resource To modify the resource default monitoring. VCS Resource System To modify the resource system default monitoring. VCS Service Group To modify the service group default monitoring. VCS System To modify the system default monitoring. VCS System Heartbeat To modify the system heartbeat default monitoring. VCS WAN Heartbeat To modify the WAN heartbeat default monitoring. Step 4 - Configure the Selected Monitor Type
- Depending on the selected Monitor Type, the available fields will vary. Refer to appropriate section below to know how to configure them.
- Click Save to apply your changes to the selected PATROL Agent(s).
Step 5 - Update the Status Mappings
The predefined status mappings can be changed, using the Monitoring Studio Web Interface.


To edit a monitoring policy
- Log on to the TrueSight console.
- In the navigation pane, expand Configuration and select Infrastructure Policies.
- In the Infrastructure Policies page, locate the monitoring policy you wish to modify, click its action button

- In the Edit Monitoring Policy page, locate the monitoring configuration you wish to modify and click its action button
- Customize the configuration.
- Click Save to apply your changes to the selected PATROL Agent(s).

Configuring VCS Servers Settings
Before using Veritas Cluster Server KM, you need to configure the monitoring settings for the Veritas Cluster Server KM Monitor Type. You will then be able to create and customize other Monitor Types according to the component(s) you wish to monitor.
To specify the options that will constitute the VCS monitoring settings:
- Create your monitoring policy.
- In the Add Monitoring Configuration dialog box, configure the properties:
- From the Monitoring Solution menu, select Veritas Cluster Server KM
- From the Version menu, select the required version
The Monitor Profile Veritas Cluster Server KM is automatically selected.
- In the VCS Monitoring Settings section, click Add.
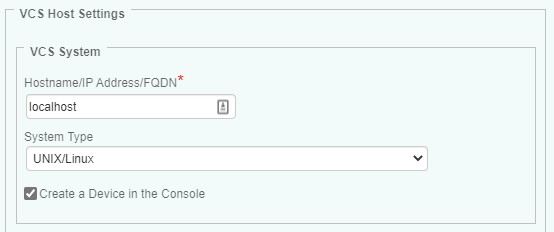
- Specify the settings for the VCS Host to be monitored:
- In the Hostname/IP Address/FQDN field:
- for a local host, enter localhost to apply these settings to all PATROL Agents installed on the VCS Servers
- for a remote host, enter the hostname or IP address of the remote VCS Host to monitor it remotely from the PATROL Agent
- In the System Type field, specify whether the VCS system is a UNIX/Linux or Windows system.
- (Optional - Remote Monitoring Only) Click the Create a Device in the Console box if you want the VCS server to appear as a separate device in TrueSight.
- In the Hostname/IP Address/FQDN field:
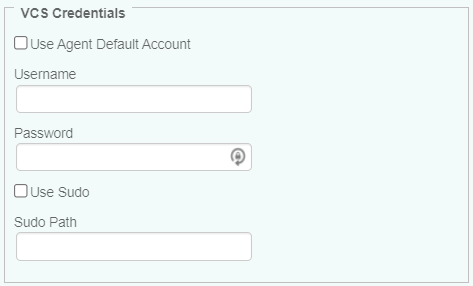
- Set the VCS Credentials:
- To use the default PATROL Agent Account, check the Use Agent Default Account option
- To use a different user account, enter the login details in the Username and Password fields
- (UNIX/Linux Only) If the user account has sudo privileges, check the Use Sudo box and indicate the sudo binary file path, if installed in a non-default path.
-
(Optional) Configure add-ons:
- If Veritas Volume Manager KM for PATROL is installed and loaded on the PATROL Agent, check Veritas Volume Manager & Volume Replicator Monitoring to enable monitoring.
- If Veritas File System KM for PATROL is installed and loaded on the PATROL Agent, check Veritas File System Monitoring to enable monitoring.
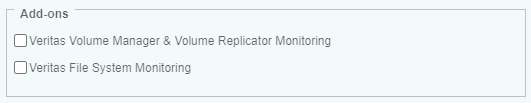
When enabled, the add-on KMs switch to Classic Mode and share the credentials and node configuration from the VCS KM. Any configuration set in TrueSight/Helix Infrastructure Policies will be ignored.
-
(Optional) Define the Advanced Settings:
-
Click OK twice.
- Click Save.


Configuring Advanced Settings
Once the Veritas Cluster Server server to be monitored and the account to be used are specified, you can configure the following advanced settings:
- The debug mode
- The remote connection settings
- The maximum number of instances
- The multi-node monitoring mode
- The VCS server discovery overrides
Enabling the Debug
The KM Debug Mode should not be enabled, unless for troubleshooting. You can follow these steps to enable/disable KM debug.
Configuring the Remote Connection Settings
To configure the remote connection settings:

- In the Connection Timeout (in Seconds) field, enter the number of seconds after which the connection to the remote node will time out
- In the Maximum Connections field, enter the maximum number of simultaneous connections allowed to the remote node
Configuring the Maximum Number of Instances
By default, the solution discovers and monitors all the instances. Because there may be a very large number of instances to monitor and this may represent an important workload to the agents and the TrueSight servers, it is recommended to only monitor the critical ones. This can be done by configuring the instance limits.
To configure the maximum number of instances:
- Edit your monitoring policy.
- Click the action button
- In the VCS Monitoring Settings panel, scroll down to the Maximum Number of Instances section.
- For each monitored element, indicate the maximum number of instances to be displayed, or enter 0 (zero) in the relevant field to disable the monitoring of a specific element. (By default, the maximum number of instances is left empty to allow an unlimited number of instances).
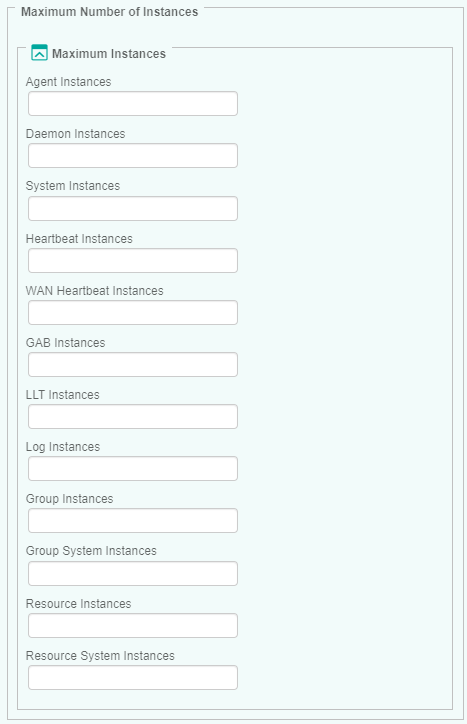
-
Click OK twice.
- Click Save.

Configuring the Multi-Node Monitoring Mode
When an application is installed in a cluster environment, i.e. active on one cluster node and passive on others, false alarms and duplicate alerts may occur. To avoid such situation, users need to configure Veritas Cluster Server KM in multi-node monitoring mode, if VCS is installed in a supported cluster.
To configure the multi-node monitoring mode:
- Edit your monitoring policy.
- Click the action button
- In the VCS Monitoring Settings panel, scroll down to the Multi-node Monitoring Mode section.
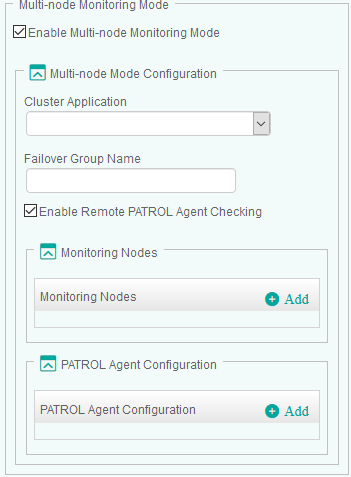
-
Check the Enable Multi-node Monitoring Mode option.
- Configure the Multi-node Mode:
- Select the appropriate Cluster Application
- Indicate the Failover Group Name. Leave this field blank if you have previously selected Veritas Cluster File System. The Veritas Cluster Server KM will then monitor the VCS system from the active master system, which is identified by
vxdctl -c modecommand. This method requiresvxconfigdin enable mode with its clustered state active.
- (Optional) Check the Enable Remote PATROL Agent Checking option to allow the solution to check the monitoring mode of the remote PATROL Agents. If the Remote PATROL Agent Checking is disabled, the solution will monitor actively through active cluster node or on the node where failover group is online and will not check the monitoring status of the Veritas Cluster Server KM on the other PATROL Agent nodes.
- In the Monitoring Nodes section:
-
Click Add to configure the details of all managed nodes of the cluster to be configured in the multi-node mode
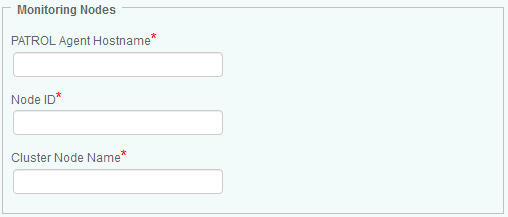
-
Provide the PATROL Agent Hostname (host where the PATROL Agent is installed), the Node ID (the unique ID of the VCS node matching the hostname in the VCS System configuration), and Cluster Node Name (the hostname defined in the selected Cluster Application)
- Click OK
- Repeat the procedure for each VCS node that is part of the multi-node mode configuration
-
-
If the Enable Remote PATROL Agent Checking option is selected, click Add in the Remote Agent Configuration section, to provide all the information required to communicate with the PATROL Agents. There should be one entry per each PATROL Agent.
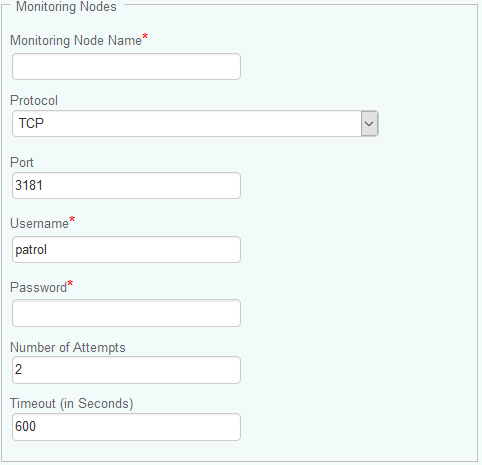
- Provide the PATROL Agent Hostname
- Select the Protocol you wish to use to connect to the PATROL Agent
- Enter the Port number you wish to use to connect to the PATROL Agent
- Provide the Username and Password you wish to use to connect to the PATROL Agent
- In the Number of Attempts field, specify the number of times the solution will try to communicate with the remote PATROL Agent before failing over
- Enter the timeout you wish to set, in seconds, between each attempt
-
Click OK twice.
- Click Save.


The VCS server will then be monitored through the master or online node in Active Multi-node Mode. The other nodes, which are standing by for a failover, will be in Passive Multi-node Mode, monitoring only the components that are not visible from the active node.
If a managed node is unable to check the monitoring status of the active managed node, it will change to Temporary Single-node Mode allowing a full VCS monitoring. It will remain in Temporary Single-node Mode until it finds the active node in full monitoring mode again.
If the Remote PATROL Agent Checking is Disabled, while there are more than one PATROL Agent involved, the managed node on the master or online node will be in Active Multi-node Mode and all others will be in Passive Multi-node Mode, without checking the monitoring status of the active node. In addition, the above procedure to configure Multi-node Mode needs to be repeated from each PATROL Agent involved.
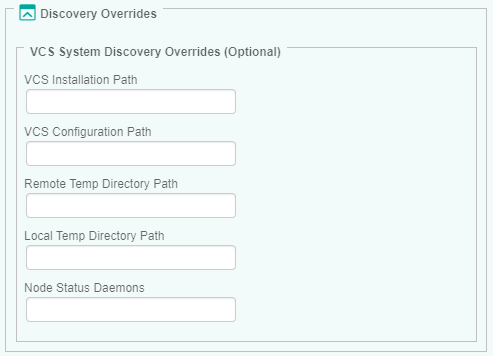
Configuring the VCS Server Discovery Overrides (Optional)
The solution automatically discovers the VCS installation, the temporary directory paths used by the Veritas Cluster Server KM, and the node status. This information can however be overridden.
To configure VCS server discovery overrides:
- Edit your monitoring policy.
- Click the action button
- In the VCS Monitoring Settings panel, scroll down to the Discovery Overrides section.
-
Specify the VCS Server Discovery Overrides options:
- VCS Installation Path: Provide the path to the directory where the VCS software is installed. By default, Veritas Cluster Server KM automatically locates the VCS software installation directory if you have installed the solution with the default recommended settings. If you have chosen to install the solution in a custom directory, you are required to provide its location.
- VCS Configuration Path: Provide the path to the directory where the VCS configuration files are stored.
- Remote Temp Directory Path: Provide the path to the directory where the temporary files are saved on remote nodes. Default is
/var/tmp(on UNIX/Linux) orC:\Windows\Temp(on Windows). - Local Temp Directory Path: Provide the path to the directory where the temporary files are saved on the PATROL Agent node (Default is
<PATROL_HOME>/lib/VCS/tmpwhere<PATROL_HOME>is the PATROL Agent installation path) - Node Status Daemons: Specify the critical VCS node daemons in order to detect the node status. Daemon names must be comma-delimited and match the file names in the process list. By default, daemons are automatically selected depending on the operating system.
- Node Status Daemons in Passive Multi-node Mode: Specify the critical VCS node daemons in order to detect the node status in Passive Multi-node Mode. Daemon names must be comma-delimited and match the file names in the process list. By default, daemons are automatically selected depending on the operating system. This is applicable only when the KM is configured to monitor in Multi-node Mode.
- Click OK twice.
- Click Save.

Configuring Other Monitor Types
By default, the solution monitors all the elements discovered, which may represent an important workload to the agents and the TrueSight OM servers. Because the monitoring of some elements may be irrelevant for various reasons, you can apply filters to indicate which elements will be monitored or not.
Filtering options are available for the following monitor types: Agents, Daemons, Systems, GABs, LLTs, Logs, Service Groups and Resources.
To configure elements to be monitored:
- Edit your TrueSight monitoring policy.
- Select the Monitor Type for which you wish to apply filters.
- In the Monitor panel, click Add.
- In the Hostname field, enter:
- localhost to apply these settings to all PATROL Agents installed on VCS Servers
- a hostname or IP address to apply these settings to a specific server.
-
Configure the Filtering options:
- In the Keep Only… section, click Add and identify the element you wish to monitor. Enter the name of the element or identify it by using a regular expression (example:
prod-client*). Click OK to validate. Repeat the operation for any other element you wish to include in the monitoring process. - In the Exclude… section, click Add and identify the element you do not want to monitor. Enter the name of the element or identify it by using a regular expression (example:
test-client*). Click OK to validate. Repeat the operation for any other element you wish to exclude from the monitoring process.
- In the Keep Only… section, click Add and identify the element you wish to monitor. Enter the name of the element or identify it by using a regular expression (example:
-
The Additional <Elements>(manual discovery) section allows you to add elements manually, when they are not automatically discovered:
- Click Add and enter the name of the element you wish to add to the monitoring environment. Click OK to validate. Repeat the operation for each element you want to monitor.
- (Optional) Enter a short description that will allow you to quickly identify the added element.
-
Click OK to validate.
Configuring Logs
By default, Veritas Cluster Server KM monitors the VCS Engine Log and the UNIX/Linux System Log or relevant Windows Event Log. Additional logs can be added in the TrueSight/Helix CMA policy. A log filter is configured by default for these log files to ensure warnings or alarms are triggered when a specific error message is found. These regular expressions can be modified using the Monitoring Studio Web Interface.
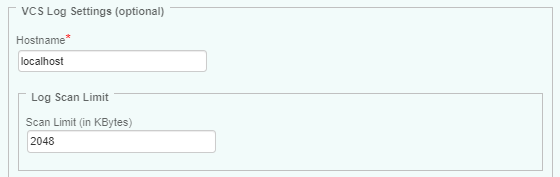
Configuring the Log Scan Limit
Veritas Cluster Server KM scans log files by reading the new log entries since the last data collection cycle. By default, 2 MBytes of data is scanned for each log file during each data collection cycle. This log scan limit can however be modified to better suit your requirements.
To customize the log scan limit:
- From the Add Monitoring Configuration panel, select VCS Log from the Monitor Type list.
- In the VCS Log Settings panel, click Add.
-
In the Hostname field, enter:
- localhost to apply these settings to all PATROL Agents installed on the VCS server
- a hostname or IP address to apply these settings to a specific server
- Indicate the amount of data (in KBytes) that will be read by the monitoring solution during each data collection cycle.
- Click OK twice.
- Click Save.

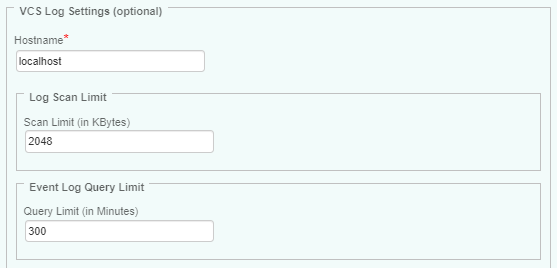
Configuring Windows Event Log Query Limit
By default, Veritas Cluster Server KM limits the Windows event log query to the last 300 minutes. This limit can however be modified to better suit your requirements.
To customize the log query limit:
- From the Add Monitoring Configuration panel, select VCS Log from the Monitor Type list.
- In the VCS Log Settings panel, click Add.
-
In the Hostname field, enter:
- localhost to apply these settings to all PATROL Agents installed on the VCS server
- a hostname or IP address to apply these settings to a specific server
- In the Query Limit (in Minutes) field, indicate the maximum limit (in minutes) you wish to query in the raw log or event log during each data collection cycle.
- Click OK twice.
- Click Save.

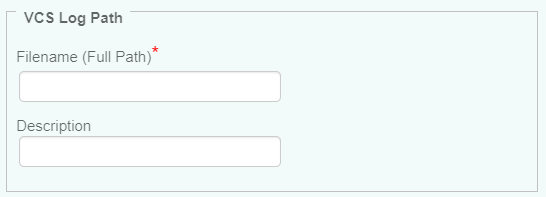
Configuring Custom VCS Logs Monitoring
To override the default configuration and add additional log files, you will have to configure the custom VCS Logs monitoring as follows:
- From the Add Monitoring Configuration panel, select VCS Log from the Monitor Type list.
- In the VCS Log Settings panel, click Add.
- In the Custom VCS Logs section, click Add.
-
In the Filename (Full Path) field, enter the full path to the VCS Log file to be monitored using backslash (/) as the file path separator (example:
\var\adm\messages). For Windows events, prefix the filename with Events - (example: Events - Systems). - (Optional) Enter a brief description of the VCS log.
- Click OK.
- Click OK twice.
- Click Save.

The KM is preconfigured with regular expressions that will generate a warning or an alarm when found in the custom VCS log. These regular expressions can be changed through the Monitoring Studio Web Interface.