Use cases
This section describes the following IBM SVC-Storwize monitoring use cases:
- Storage Capacity Monitoring and Optimization
- Performance Optimization
- Traffic Management
Storage Capacity Monitoring and Optimization
Making sure that a storage system has enough remaining disk space available is critical for several reasons:
-
SAN administrators want to make sure to be able to provision disk space for new servers when requested, as quickly as possible.
-
The storage system itself may need additional disk space for specific features to work properly, like automatic snapshots, mirroring, etc.
-
If thin provisioning is used, the remaining disk space becomes dramatically critical since the inability to allocate additional space to a LUN when requested by the subscriber host will lead to catastrophic data loss and corruption.
Reporting on Disk Space Consumption
The disk space used is permanently monitored for each IBM SVC-Storwize storage pool:
-
The SubscribedCapacity parameter of the SEN_SVCSTORWIZE_STORAGEPOOL application class represents the amount of disk space that has been made available to the subscriber hosts, or in other words, the amount of disk space that is seen by the servers connected to the IBM SVC-Storwize System.
-
The ConsumedCapacity parameter of the SEN_SVCSTORWIZE_STORAGEPOOL class represents the actual space usage in the pool. For “thin” pools (when thin provisioning is enabled on the IBM SVC-Storwize System), this value is normally lower than the SubscribedCapacity, as it is the main purpose of thin provisioning. For traditional pools, the ConsumedCapacity parameter has the same value as the SubscribedCapacity parameter, as the entirety of the subscribed disk space is fully allocated in the storage pool.
-
The ConsumedCapacityPercentage parameter is the most critical one as a pool usage nearing 100% means that SAN administrators will not be able to create new LUNs. By default, an alarm is triggered if the value of this parameter exceeds 75%.
To verify the available disk space in several storage pools:
-
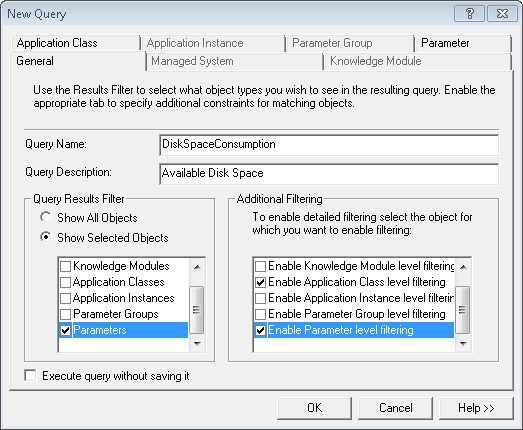
Create a PATROL Query in the PATROL Console to show the value of the ConsumedCapacityPercentage parameter of the SEN_SVCSTORWIZE_STORAGEPOOL application class; In the main menu bar, click Action > New Query…
-
Enter the Query name (example: Disk Space Consumption)
- Enter the Query description (optional)
- In the Query Results Filter section, select Show Selected Objects and check the Parameters box
- In the Additional Filtering section, select the Enable Application Class level filtering and the Enable Parameter level filtering options
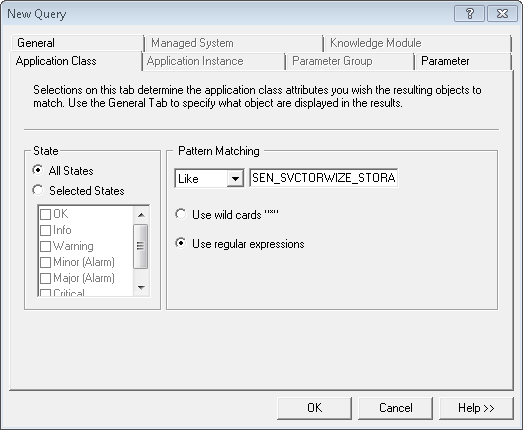
- Open the Application Class tab
- In the Pattern Matching section, select Like and type SEN_SVCSTORWIZE_STORAGEPOOL
-
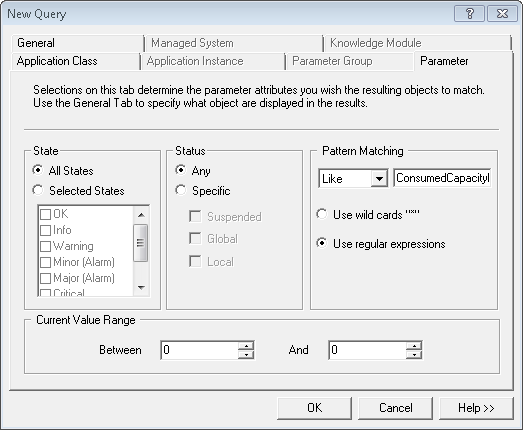
Open the Parameter tab
- In the Pattern Matching section, select Like and type ConsumedCapacityPercentage
-
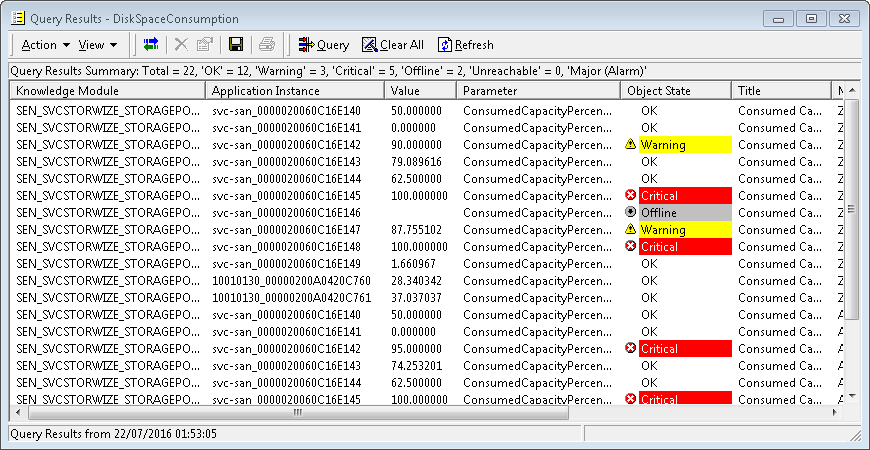
Click OK to display a table with the amount of actually consumed capacity in all of the storage pools of your monitored IBM SVC-Storwize systems.
Reclaiming Space of Unused LUNs
Identifying Unmapped (Orphans) LUNs
Over time, as servers connected to a SAN get decommissioned, administrators find an increasing number of unmapped LUNs, or volumes that are no longer used by any server. These LUNs, while unused, still occupy disk space in the storage system. Being able to identify such unmapped LUNs and reclaim the disk space uselessly consumed by these LUNs will help administrators avoid unnecessary upgrades and extensions of their storage systems.
To list the LUNs in a storage system that are not mapped to any server and therefore safe to remove, right-click the KM main icon > KM Commands > Reporting > LUNs Mapping Table…
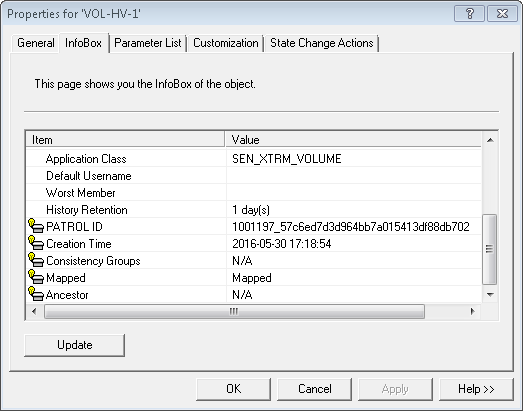
Whether a LUN is actually mapped or not is also shown in the InfoBox of each volume instance.
Identifying Unused LUNs
When a server is decommissioned or reconfigured, its associated LUNs can stay mapped preventing storage administrator from accurately identifying unused LUNs. Since the KM monitors permanently the traffic on each LUN, it becomes easy to detect LUNs for which the activity is null.
-
Create a PATROL Query in the PATROL Console to show the value of the TimeSinceLastActivity parameter of the SEN_SVCSTORWIZE_VOLUME application class; In the main menu bar, click Action > New Query…
-
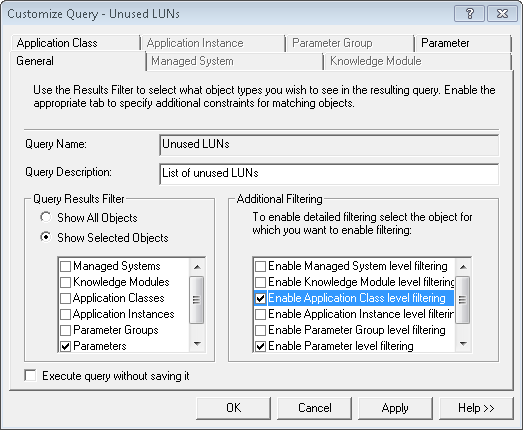
Enter the Query name (example: Unused LUNs)
- Enter the Query description (optional)
- In the Query Results Filter section, select Show Selected Objects and check the Parameters box
- In the Additional Filtering, select the Application Class level filtering and the Enable Parameter level filtering options
- Open the Application Class tab
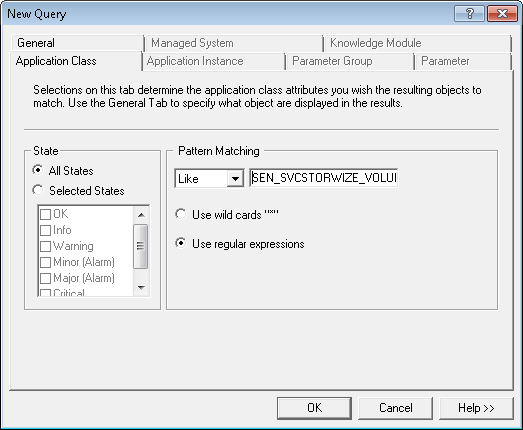
-
In the Pattern Matching section, select Like and type SEN_SVCSTORWIZE_VOLUME
- Open the Parameter tab
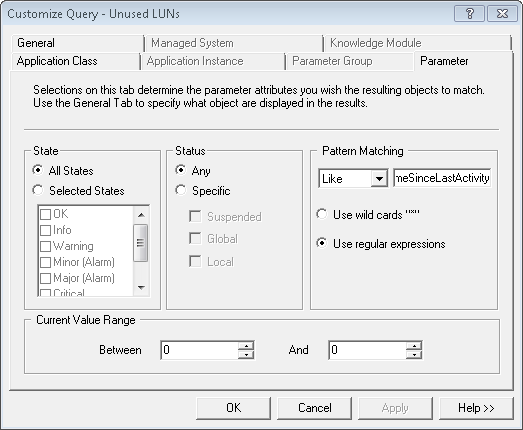
-
In the Pattern Matching section, select Like and type TimeSinceLastActivity
- Click OK to display a list of the monitored LUNs and their respective number of days since when the KM has not recorded any activity.
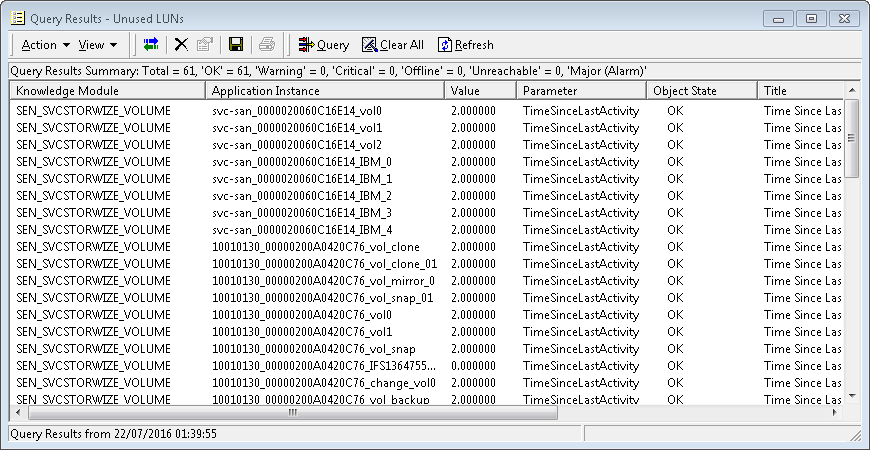
The value collected for this parameter upon the first collect reflects the number of days since any activity occurred on the volume for the time observed by the KM, i.e. this first collected metric might not reflect the actual absence of activity on the volume.
Performance Optimization
Diagnosing SAN/Network Contention
The IBM SAN Volume Controller can be considered as a storage proxy. As such, it concentrates the storage activity from many hosts and many back-end systems. Therefore, its network and fiber connectivity and performance needs to be optimal at all times. The IBM SVC-Storwize KM monitors both the iSCSI and fiber ports for the connectivity and the traffic. For the fiber ports, additional information is provided to identify the origin and/or destination of the traffic (internal, other cluster, hosts or storage systems). This allows SAN administrators to precisely understand the cause of any SAN or network contention.
To diagnose SAN / Network Contention:
-
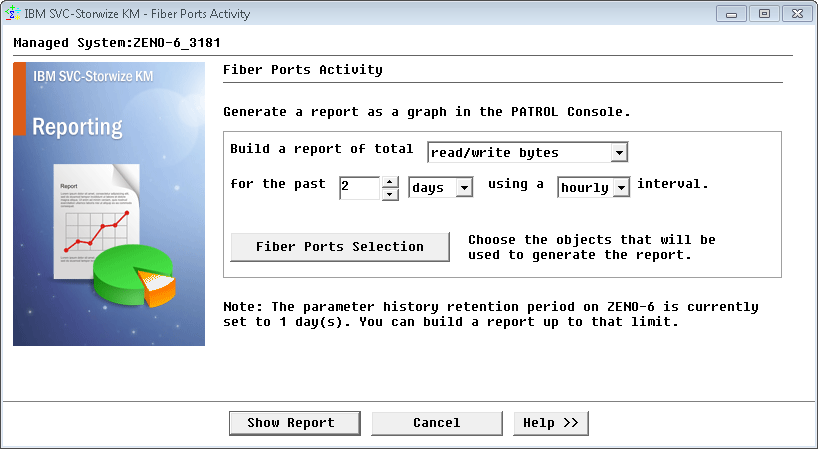
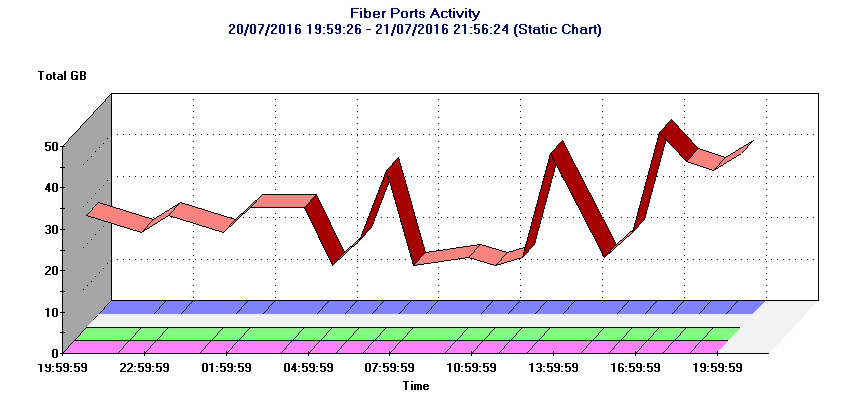
Generate a total activity report on each fiber port: In the PATROL Console, right-click the Fiber Ports main icon > KM Commands > Fiber Ports Activity…
-
Build a report of total read/write bytes for the period of your choice
-
Click Show Report
Diagnosing Slow LUNs
If a system administrator complains that his servers are experiencing slow I/Os performance and that it is caused by the SAN, you may want to verify the actual response time of the LUNs the server is relying on.
The ReadResponseTime and WriteResponseTime parameters of the SEN_SVCSTORWIZE_VOLUME class represent the average time it took to complete the read and write operations on the LUN during the collection interval. Typically, the average response time is below 10 milliseconds. You may also want to compare this value to the response time of the other LUNs to see whether one server is really getting worse I/O performance than another.
If the response time is low, you will need to check the amount of data that is written and read on this LUN. The bad performance may simply be due to an abnormally large amount of data to process. Otherwise, the problem may lie between the IBM SVC-Storwize storage system and the server, in the fiber links.
Response time parameters, in general, can show sporadic high values. A high response time value does not equal to performance degradation until the problem lasts for a few consecutive collections. The default thresholds for the response time parameters trigger an alert only after a certain amount of time.
Identifying a Bottleneck in an IBM SVC-Storwize Storage System
Storage virtualization adds great flexibility in the provisioning and management of storage but also adds a lot of complexity when it comes to identifying and diagnosing a performance problem: are the nodes themselves the bottleneck, or the fiber ports or the back-end storage systems?
The IBM SVC-Storwize KM provides performance metrics for every layer of the SAN infrastructure based on the IBM SVC-Storwize storage system. To easily find the reason for a degraded performance or perceived as degraded, we recommend you to verify in this order the performance of:
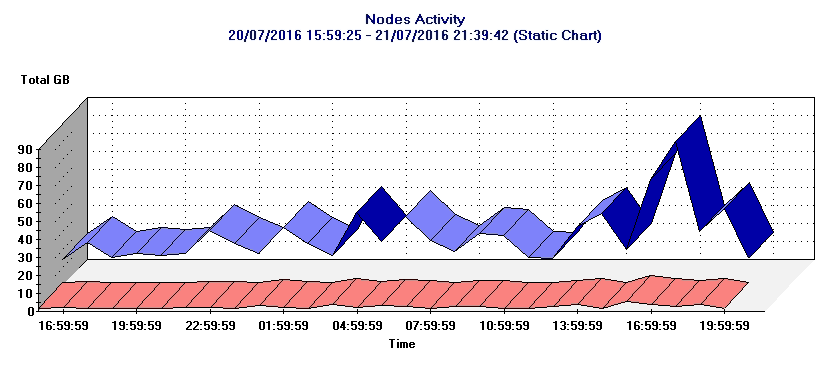
Verifying the Performance of the Nodes
-
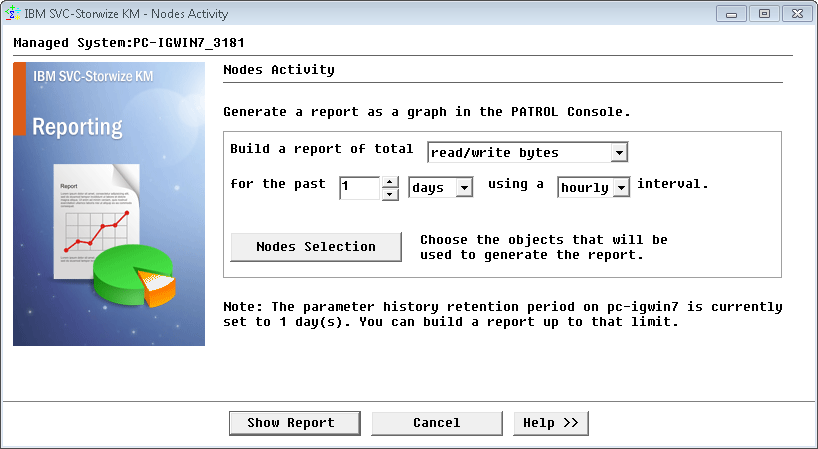
Right-click the Nodes main icon > KM Commands > Reporting > Nodes Activity…
-
Build a report of total read/write bytes for the period of your choice
- Click Show Report.
Verifying the Activity on Ports
-
Start looking at the total activity on each port: In the PATROL Console, right-click the Fiber Ports main icon > KM Commands > Reporting > Fiber Ports Activity…
-
Build a report of total read/write bytes for the period of your choice
-
Click Show Report.
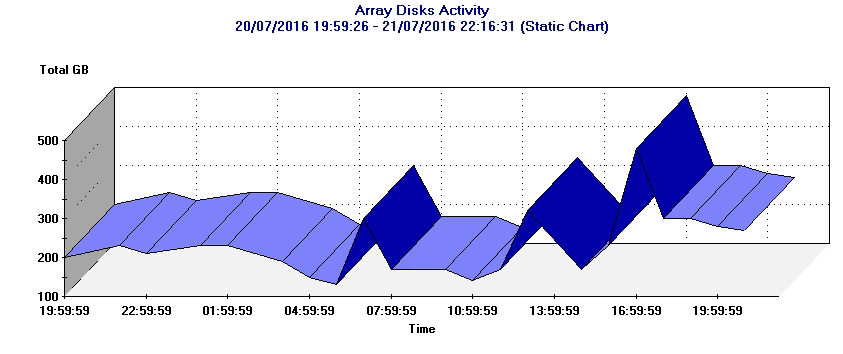
Verifying the Performance of the Storage Systems
-
Right-click the Storage System icon > KM Commands > Reporting > Storage System Activity…
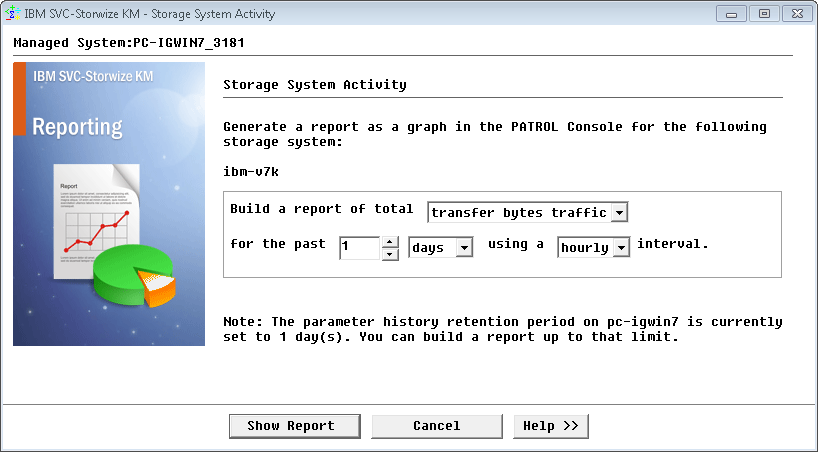
-
Build a report of total transfer bytes traffic for the period of your choice
-
Click Show Report.
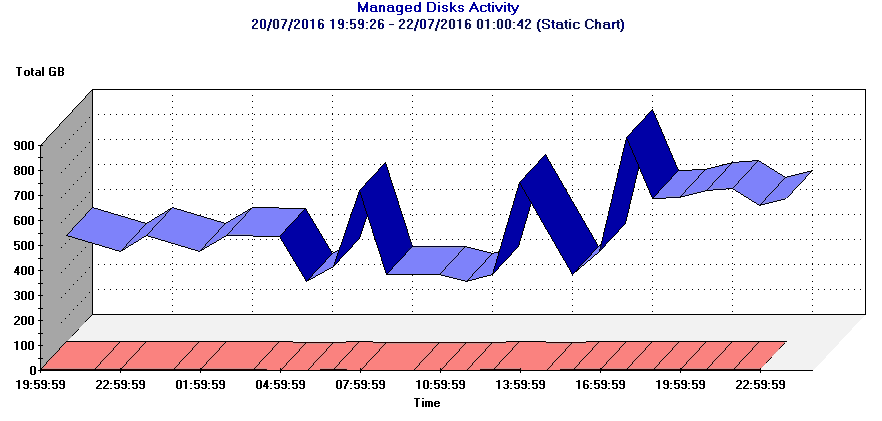
Verifying the Activity on Managed Disks
-
Right-click the Storage System icon > KM Commands > Reporting > Managed Disks Activity…

-
Build a report of total read/write bytes for the period of your choice
- Click Show Report.
Traffic Management
Identifying Busiest LUNs
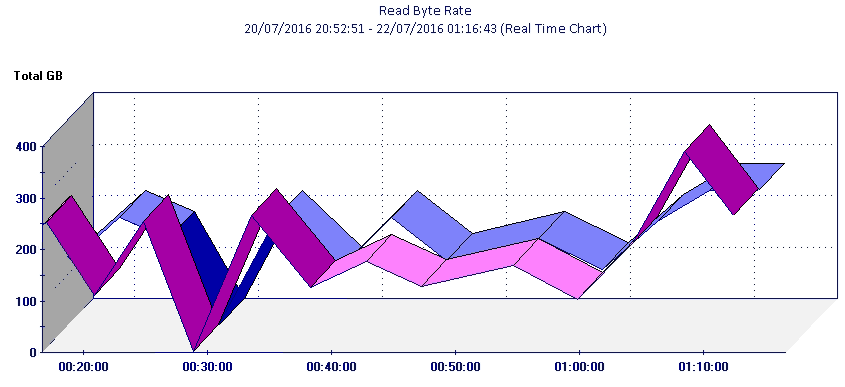
To identify the LUNs that generate the most traffic on the disk array, you can use the ReadByteRate and WriteByteRate parameters of the SEN_SVCSTORWIZE_VOLUME class. IBM SVC-Storwize KM for PATROL offers you two methods to visually represent a LUN traffic:
Method 1: Creating a Multi-Parameter Graph
- In the PATROL console, double-click the ReadByteRate parameter of the LUN you are interested in. A graph is automatically displayed in the graph pane.
- Then drag and drop the WriteByteRate parameter in the graph window
Method 2: Using the Volume Activity… Command
- Right-click the Volume for which you want to create a report and select Volume Activity…
- Define the report settings:
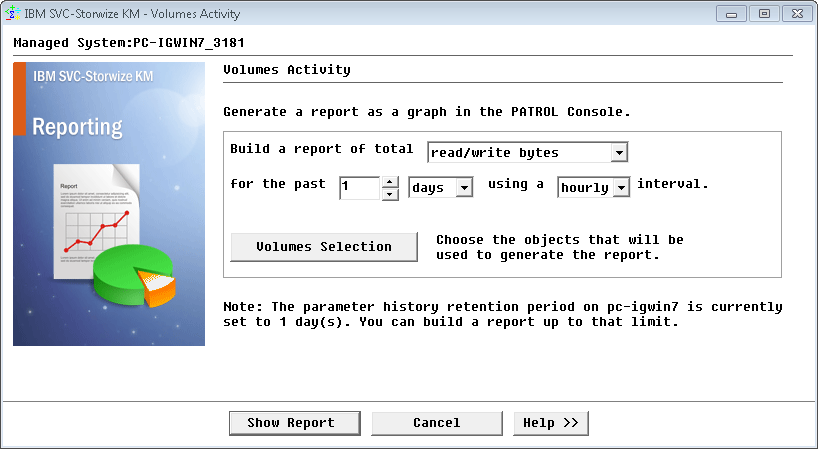
- Select the data for which you wish to generate a report for: read bytes traffic, write bytes traffic or both.
- Select the period that you wish the report to cover: number of days or hours
- Select the interval to apply to the report data: hourly or daily
- Click the Show Report button to display the graph.
Once you have identified the busiest LUNs, check the InfoBox of the suspected LUNs to find their storage groups and the hosts that generate such traffic.
Reporting the Total Traffic on an Hourly or Daily Basis
IBM SVC-Storwize KM for PATROL not only monitors the traffic and activity of the storage system, LUNs and physical disks in MB/sec, but also in GB per hour or per day. The exact amount of data that was read or written to the storage system, LUN or physical disk is calculated for each hour of the day and each day of the week.
The hourly report graph will represent the amount of data in GB from 12:00am to 12:59am, from 1:00am to 1:59am, from 2:00am to 2:59am, etc, while the daily report graph will represent the amount of data in GB for Monday, for Tuesday, for Wednesday, etc.
This report is notably helpful to SAN administrators to understand the impact of the nightly backups, of the amount of data a specific application writes to a LUN and how this evolves (with upgrades for example). In general, this will help administrators analyze the impact of various features of the storage system on the long term.
Generating Storage Systems Activity Report
- In the console, right-click the KM main icon > KM Commands > Reporting > Storage Systems Activity…
- Define the report settings
- Select the data you wish to generate a report for
- Select the period that you wish the report to cover
- Select the interval to apply to the report data
-
Press the Storage Systems Selection button and select the specific storage system(s) you wish to include in the report
- Click the Show Report button to display the graph
The ability of the product to report on a given period of time depends on the history retention period of the PATROL Agent.
svc storwize km patrol