Using IBM SVC-Storwize KM for PATROL
Once IBM SVC-Storwize KM for PATROL has been successfully installed and configured, you can:
- Choose the information to be displayed in the PATROL console
- Generate reports
- Refresh the information displayed
- Find which device corresponds to the WWN or IQN found in an error log.
Choosing the Information Displayed in the PATROL Console
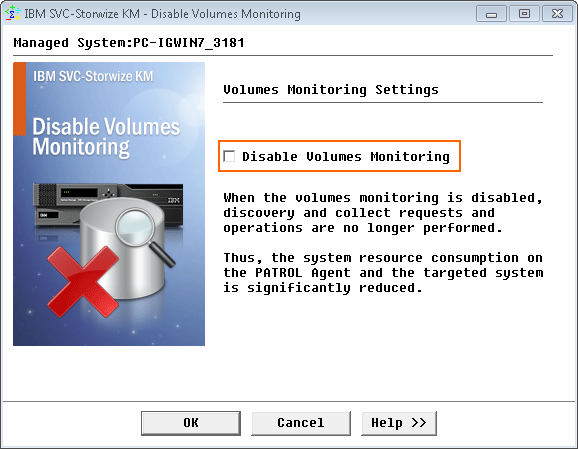
Disabling Volumes Monitoring
Discovering and collecting volumes metrics are resource-intensive actions that can create extra workload on the PATROL Agent and the targeted system. To limit the number of instances created and therefore reduce the system resource consumption, administrators can disable the monitoring of all the volumes of a system.
To disable volumes monitoring:
-
Right-click the IBM SVC-Storwize Storage Manager icon > KM Commands > Disable Volumes Monitoring…
-
Select Disable Volumes Monitoring and click OK.
Discovery and collect requests and operations are no longer performed. Volumes no longer appear in the PATROL Console.
To resume volumes monitoring, perform the steps above, uncheck the Disable Volumes Monitoring box and click OK.
Pausing/Resuming Monitoring
In order to perform certain tasks, such as maintenance for example, it is often useful to pause the monitoring of an element or a group of elements. To pause the monitoring of a specific element or group of elements, right-click the element (or element container) icon > KM Commands > Pause Monitoring.
When in paused state, the element/group of elements is displayed with an OFFLINE status in the PATROL Console. Additionally, the mention ‘(Suspended)’ appears beside each related parameter.
To resume the monitoring of the element/group of elements, right-click the element (or element container) icon > KM Commands > Resume Monitoring in the menu.
Removing Device Monitoring
Whenever the supervision of an element/group of elements becomes irrelevant, it is possible to terminate its monitoring by right-clicking the element icon > KM Commands > Remove.
Once removed, the element/group of elements is no longer displayed in the PATROL Console. The Remove KM Command only prevents the display of instances in the PATROL Console. The discovery and collect processes are still performed in the background.
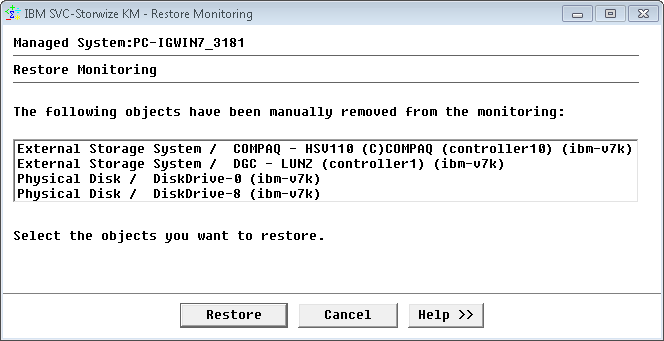
Restoring Monitoring
It is possible to restore the monitoring of a device with IBM SVC-Storwize KM for PATROL after it has been removed from monitoring environment through the Remove option. To see the list of the removed devices or to restore the monitoring of a specific device:
-
Right-click the KM main icon > KM commands > KM Settings > Additional Settings > Restore Monitoring…
-
Select:
- <ALL> if you want to restore the monitoring of all the devices that have been previously removed in the PATROL Console
- One or more objects if you only want to restore specific devices (press down the Ctrl-key to allow multiple selection)
- Click Restore.
Generating Reports
Generating Activity Reports
IBM SVC-Storwize KM for PATROL enables you to generate activity reports for:
- Storage Systems
- Nodes
- Array Disks
- Fiber Ports
- Managed Disks
- Storage Pools
- Volumes Activity.
To generate an activity report:
- Right-click the KM main icon > KM Commands > Reporting and then the report you wish to obtain.
- Select the parameter for which you wish to generate a report for (e.g.: transfer bytes).
- Select the report range and interval.
- (Optional) Press the components Selection button and select the specific component(s) you wish to include in the report.
- Click Show Report.
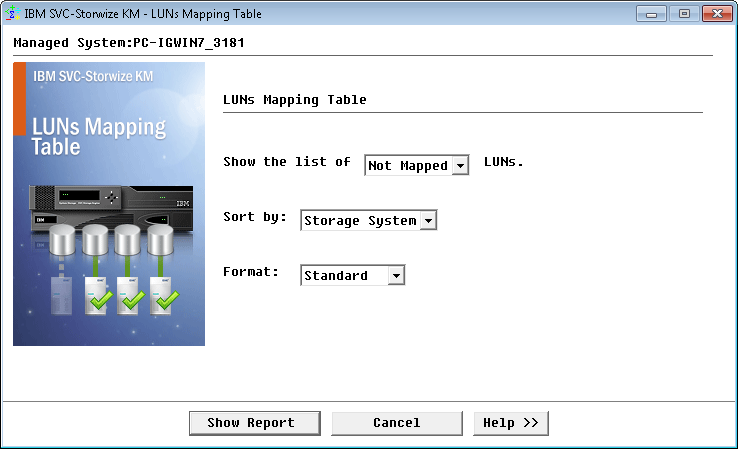
Generating the LUNs Mapping Table
Over time, as servers connected to a SAN get decommissioned, administrators find an increasing number of unmapped LUNs that are no longer used by any server. These LUNs, while unused, still occupy disk space in the disk array. To identify such unmapped LUNs and reclaim the disk space uselessly consumed by these LUNs, administrators can use the LUNs Mapping Table.
-
In the console, right-click the KM main icon > KM Commands > Reporting > LUNs Mapping Table…
-
Select the type of LUNs you wish the list to display: Not Mapped, Mapped or All
- Select the sorting order: Storage System, Hostname, Host WWN/IQN, LUN, Ports or Size
- Select the format: Standard or CSV
- Click Show Report to display a list of LUNs corresponding to your requirements.
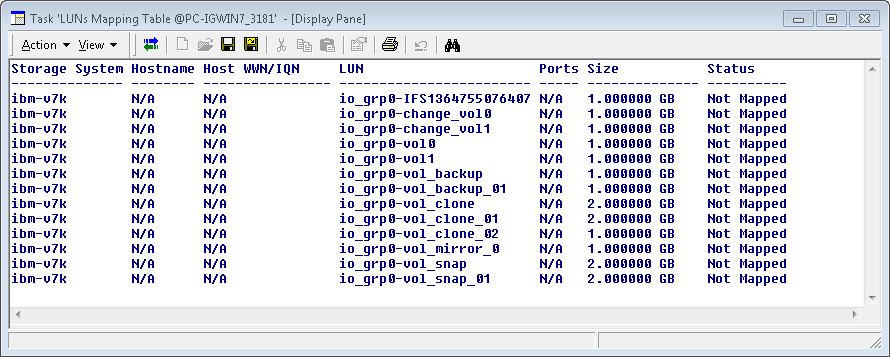
Whether a LUN is actually mapped or not is also shown in the InfoBox of each volume instance.
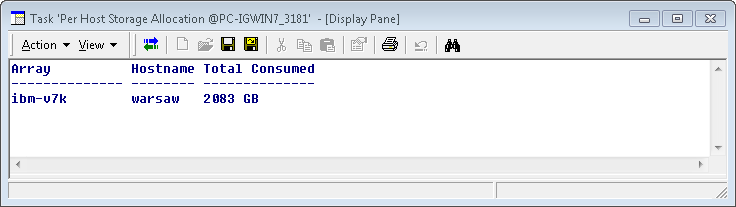
Generating the Per Host Storage Allocation Report
The Per Host Storage Allocation reports on the amount of storage allocated to each monitored host.
- In the console, right-click the KM main icon > KM Commands > Reporting > Per Host Storage Allocation…
- The report shows the total amount of consumed storage capacity for each monitored host.
Generating the Per LUN Storage Allocation Report
The Per LUN Storage Allocation reports on the amount of storage allocated to each monitored LUN.
- In the console, right-click the KM main icon > KM Commands > Reporting > Per LUN Storage Allocation…
- The report shows the total amount of consumed storage capacity for each monitored LUN.
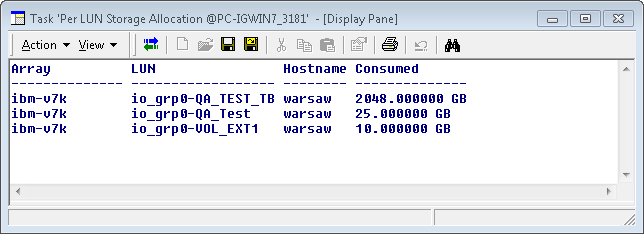
The list of results will be truncated in large environments if the buffer size is not sufficient to display all the LUNs available. Refer to the BMC documentation to know how to change the buffer size.
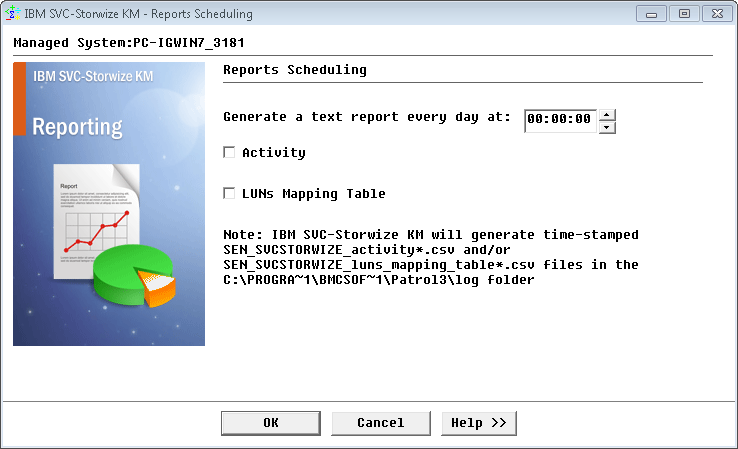
Scheduling Reports
Administrators can generate activity and LUNs Mapping Table reports every day at a specific time.
To schedule reports:
-
Right-click the KM main icon > KM Commands > Reporting > Reports Scheduling. The Reports Scheduling wizard appears:
-
Specify the time when the reports are automatically generated.
- Check the Activity report type to automatically generate the following reports:
- Storage Systems Activity: Reports on Transfer, Read and Write Bytes for all monitored storage systems
- Nodes Activity: Reports on Transfer, Read and Write Bytes for all monitored nodes
- Array Disks Activity: Reports on Transfer, Read and Write Bytes for all monitored array disks
- Fiber Ports Activity:Reports on Transfer, Sent and Received Bytes for all monitored fiber ports
- Managed Disks Activity: Reports on Read and Write Bytes for all monitored managed disks
- Storage Pools Activity: Reports Transfer, Read and Write Bytes on for all monitored storage pools
- Volumes Activity: Reports on Transfer, Sent and Received Bytes for all monitored volumes
-
Select LUNs Mapping Table to list mapped and unmapped LUNs. The .csv file generated for this report consists in the following comma-separated data: Storage System, Hostname, Host WWN/IQN, LUN, Ports or Size.
-
Click OK.
The generated file(s) are time-stamped and stored in %PATROL_HOME%\log for the specific time set through the History Retention Period parameter.
Refreshing the Information Displayed
Manually Acknowledging Error Count Alerts and Resetting
Some parameters of the FC Port instances keep increasing as new errors are encountered. The counter starts with the value present at the PATROL Agent start or upon the KM reinitialization. When no error occurs, the parameters remain at zero. Each time an error occurs the corresponding parameter is increased by 1 (one), and the KM retains this NEW value until it is acknowledged.
The KM provides a specific KM Command to acknowledge alerts on a FC Port parameter. This functionality only applies to the parameters of the FC Port instances. It allows administrators to manually acknowledge alerts and reset the parameters’ counters.
To manually acknowledge and reset a FC Port instance parameter, right-click a FC Port instance > KM Commands > Acknowledge ErrorCount Alerts and Reset.
Automatically Acknowledging Error Count Alerts and Resetting
ErrorCount-type parameters keep increasing as new errors are encountered. When one error occurs, the ErrorCount-type parameter is increased to 1 (one), and retains this value until it is acknowledged. When another error occurs, the ErrorCount-type parameter is automatically increased to 2 (two), and again, it retains this value until it is acknowledged.
Because manually acknowledging ErrorCount alerts can rapidly become time consuming, IBM SVC-Storwize KM for PATROL can be configured to automatically acknowledge an alert on ErrorCount parameters and reset them to zero after a specified period of time.
- Right-click the IBM SVC-Storwize KM icon > KM Commands > KM Settings > Automatic ErrorCount Parameters Reset
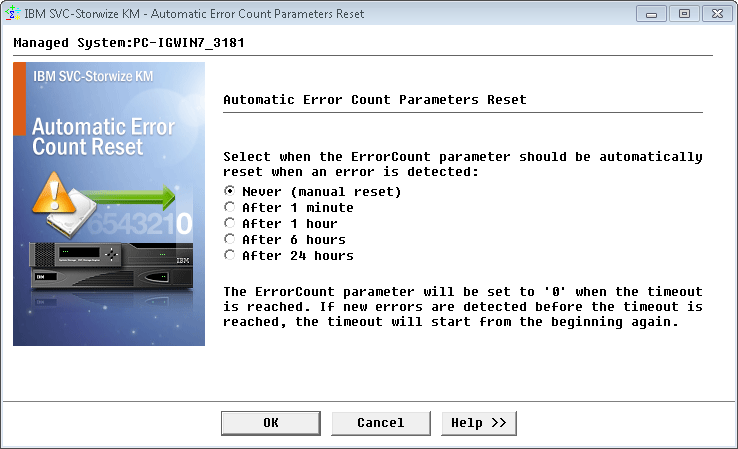
- Select the period of time after which you want the KM to automatically reset the ErrorCount parameters:
- Never (manual reset)
- After 1 minute
- After 1 hour
- After 6 hours
- After 24 hours
- Click OK.
In many cases, an error that does not reoccur after a certain amount of time can be safely ignored. Automatically resetting ErrorCount parameters to zero after a few hours is often considered as a good practice.
Refreshing Parameters
To manually refresh parameters without waiting for an automatic polling cycle, right-click the IBM SVC-Storwize Storage Manager icon > Refresh Parameters.
Triggering a KM Discovery
IBM SVC-Storwize KM for PATROL automatically executes a discovery every hour of all objects for the monitored system. This enables discovering and then monitoring any new object added or removed.
You can also force a discovery manually by right-clicking on the KM main icon > KM Commands > Trigger a KM Discovery.
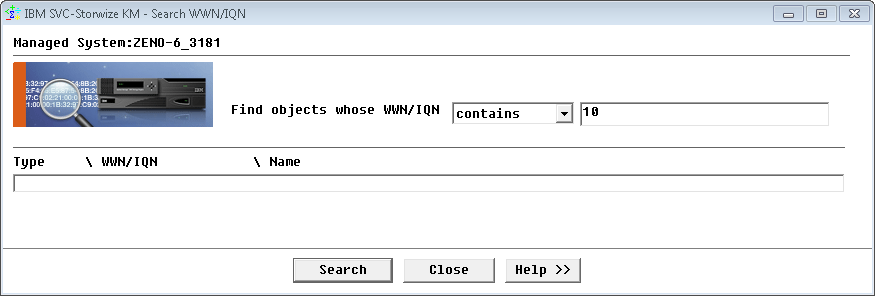
Searching WWN/IQN
Components are uniquely identified on the SAN by a WWN or by an iSCSI name. Because a WWN is a series of letters and digits and IQN can be up to 255 characters long, retrieving a device or port corresponding to a WWN or IQN found in error log or any other administration GUI is a nightmare for SAN administrators. The Search WWN/IQN feature has been designed to easily find any component based on its complete or partial World Wide Name or IQN.
In the console:
- Click the KM main icon > KM Commands > Search WWN/IQN…
- Select a search option: Contains, Starts with, or Ends with.
- Type the value to search for.
-
Click Search to display the search results
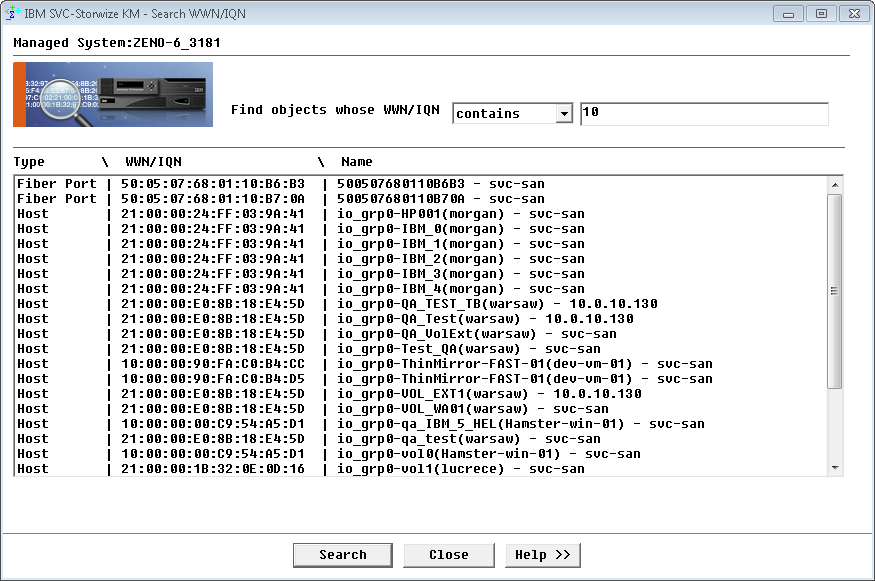
- The search results panel lists the WWN/IQN corresponding to the search options you have defined.
svc storwize km patrol