-
Home
- Green IT
Green IT Features
This chapter describes the main features, views and reports provided by the Green IT extension embedded with the TSPS Component.
The features described here are only available if you have installed the Hardware Sentry TSPS Component. Refer to Install the Component for more information.
Basic Concepts and Terminology
| Property | |
|---|---|
| Power Consumption | Amount of watts consumed by a physical device. This corresponds to the Power Consumption parameter of the Hardware Sentry KM Report Monitor. |
| Total Power Usage | Amount of kW consumed by all physical devices for a specific Group, Application or Service. This value is computed by the Green IT engine. |
| Heating Margin | Number of degrees Celsius (°C) remaining before the temperature reaches the closest warning threshold. This value is computed by the Green IT engine based on the Degrees Below Warning parameter of the Hardware Sentry KM Report Monitor. |
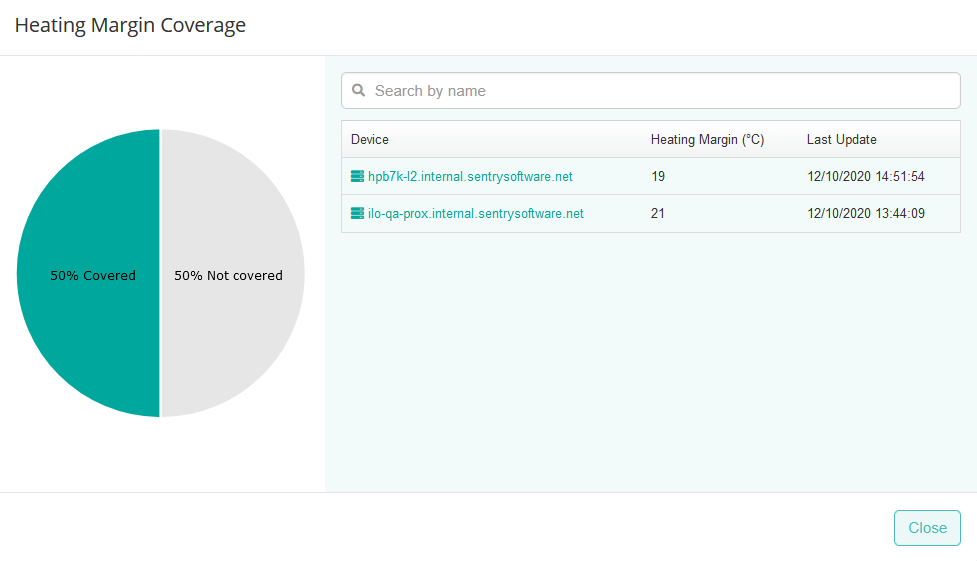
| Heating Margin Coverage | Percentage of the number of physical devices on which the heating margin is computed. |
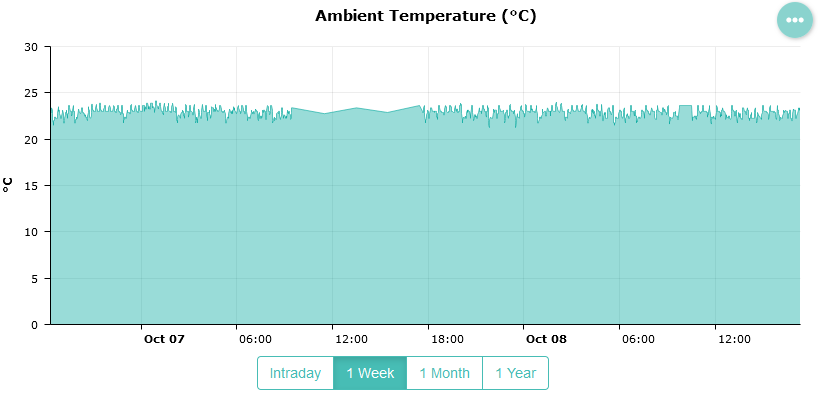
| Ambient Temperature | Current ambient temperature reading of a Group in degrees Celsius (°C). |
| Confidence | Percentage of available data out of the total number of hardware devices for a specific period (e.g. Day, Month, Year). |
Hardware Devices Menu
The Hardware Devices menu provides an overview and a detailed page for all the physical devices currently monitored by Hardware Sentry.
-
Log on to the TrueSight Console and click the Hardware Devices menu in the navigation pane.
-
Click the name of a device to open its Device Details page.
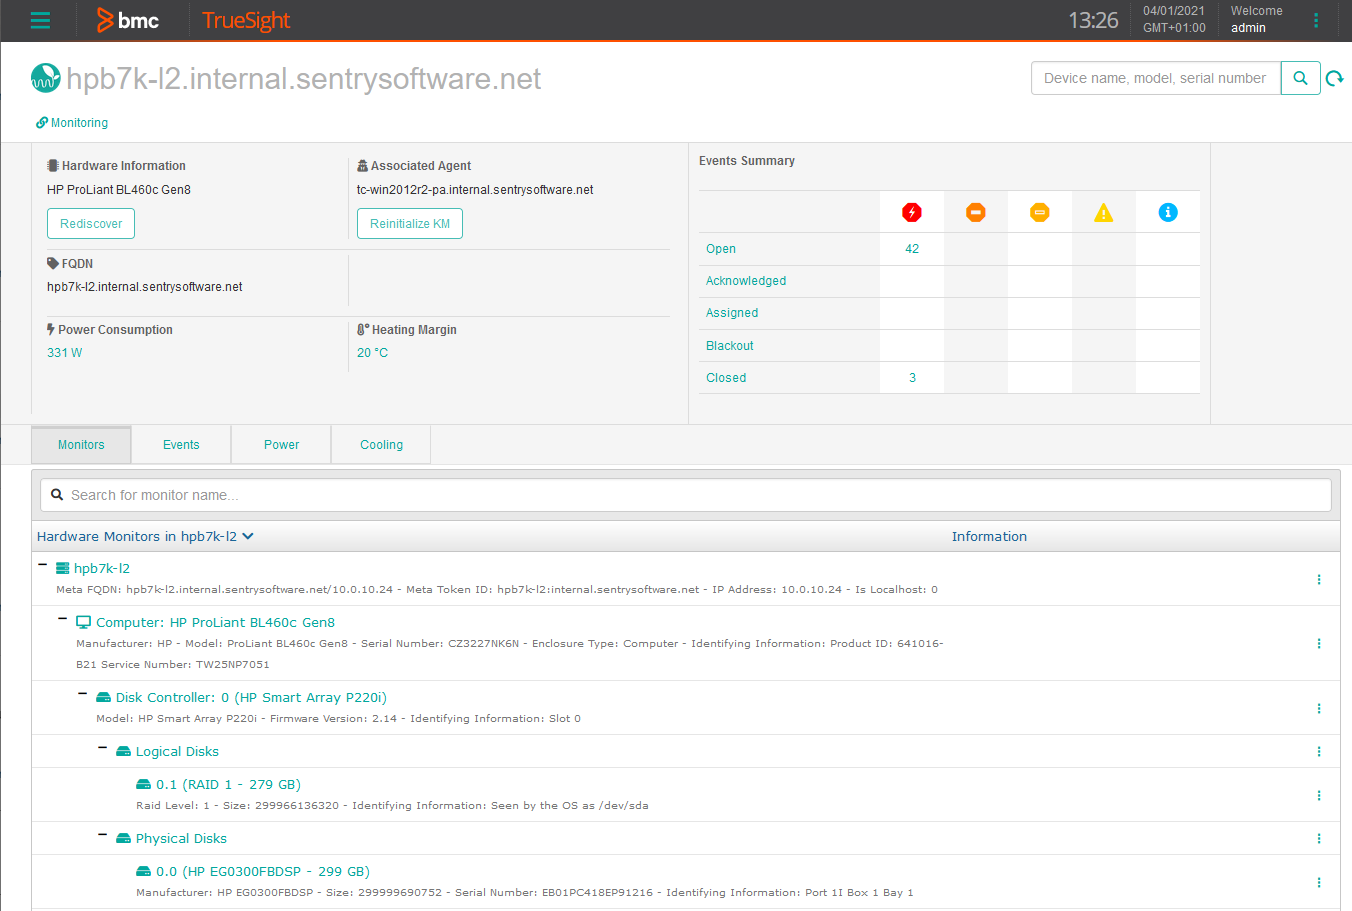
Look at the top of the page to get an overall view of basic information about the device (Agent, FQDN, power consumption and the heating margin, etc.), and a summary of all the events that are associated with the device. Note that by default, Hardware Sentry performs a discovery of all the monitored devices every hour to detect new and missing hardware components but, you can manually launch a discovery on the device by pressing the Rediscover button. When necessary, you can also use the Reinitialize button to reset configuration and let Hardware Sentry re-start monitoring from scratch. Learn more about reinitialization in the Troubleshooting chapter.
-
The page also provides additional information distributed across 4 tabs: Monitors, Events, Power and Cooling.
Monitors Tab
The Monitor tab provides a hierarchy view of all the Monitors associated with the hardware device.
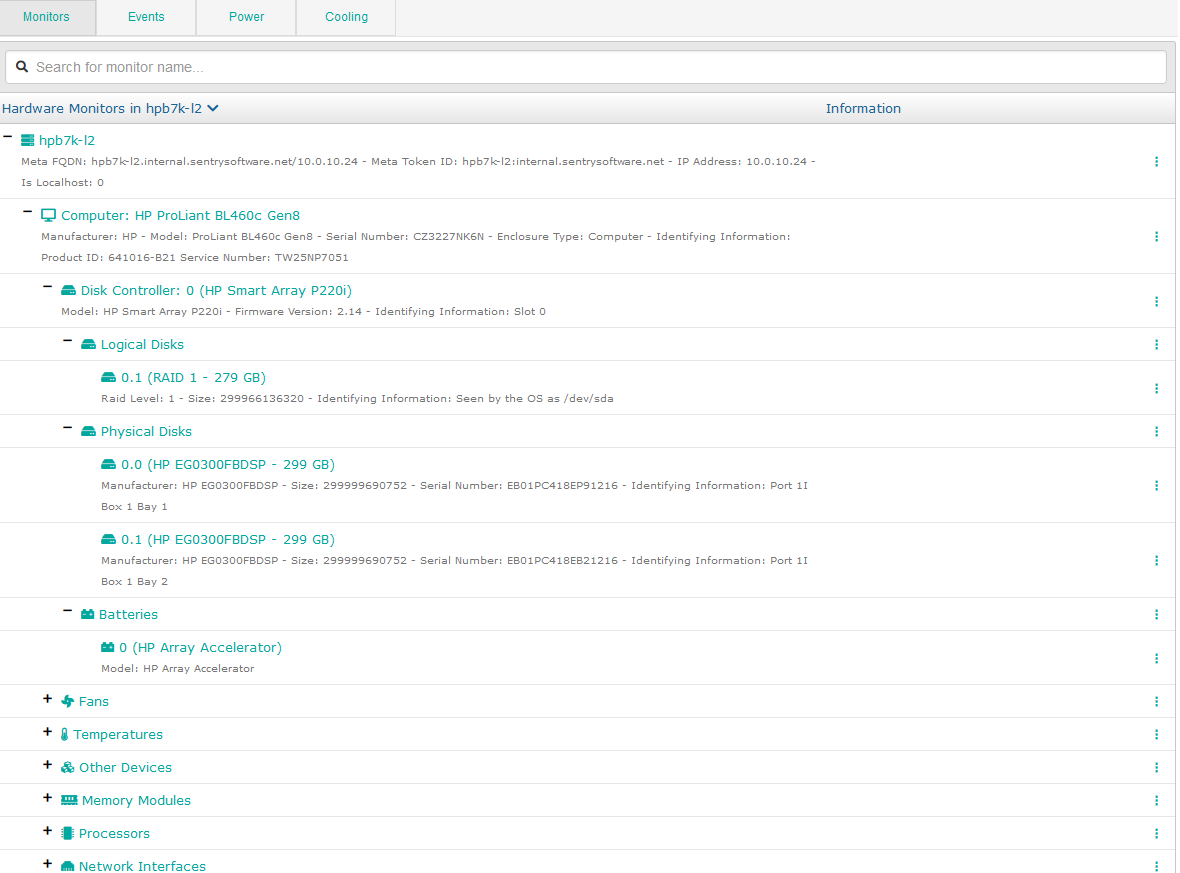

- Collect Now: to launch a data collect on the Monitor or device
- Reset Error Count: to acknowledge and reset to zero the Error Count parameter in alert for the Monitor or device
- Remove Missing: to remove the component from the monitoring environment when it has been detected as missing since the last collect.
Click a Monitor in the view to display detailed information about its associated hardware device and PATROL Agent, event streaming status, energy usage data, etc.
Events Tab
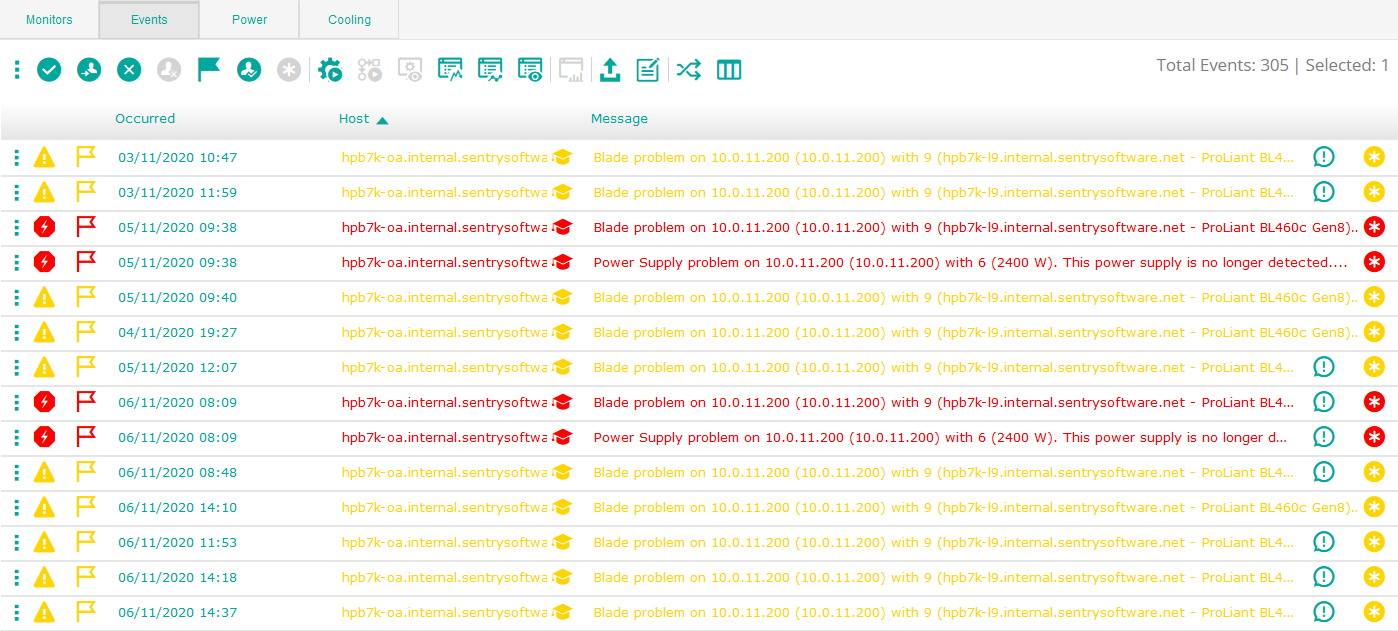
The Events tab lists the events associated with the hardware device.
Power Tab
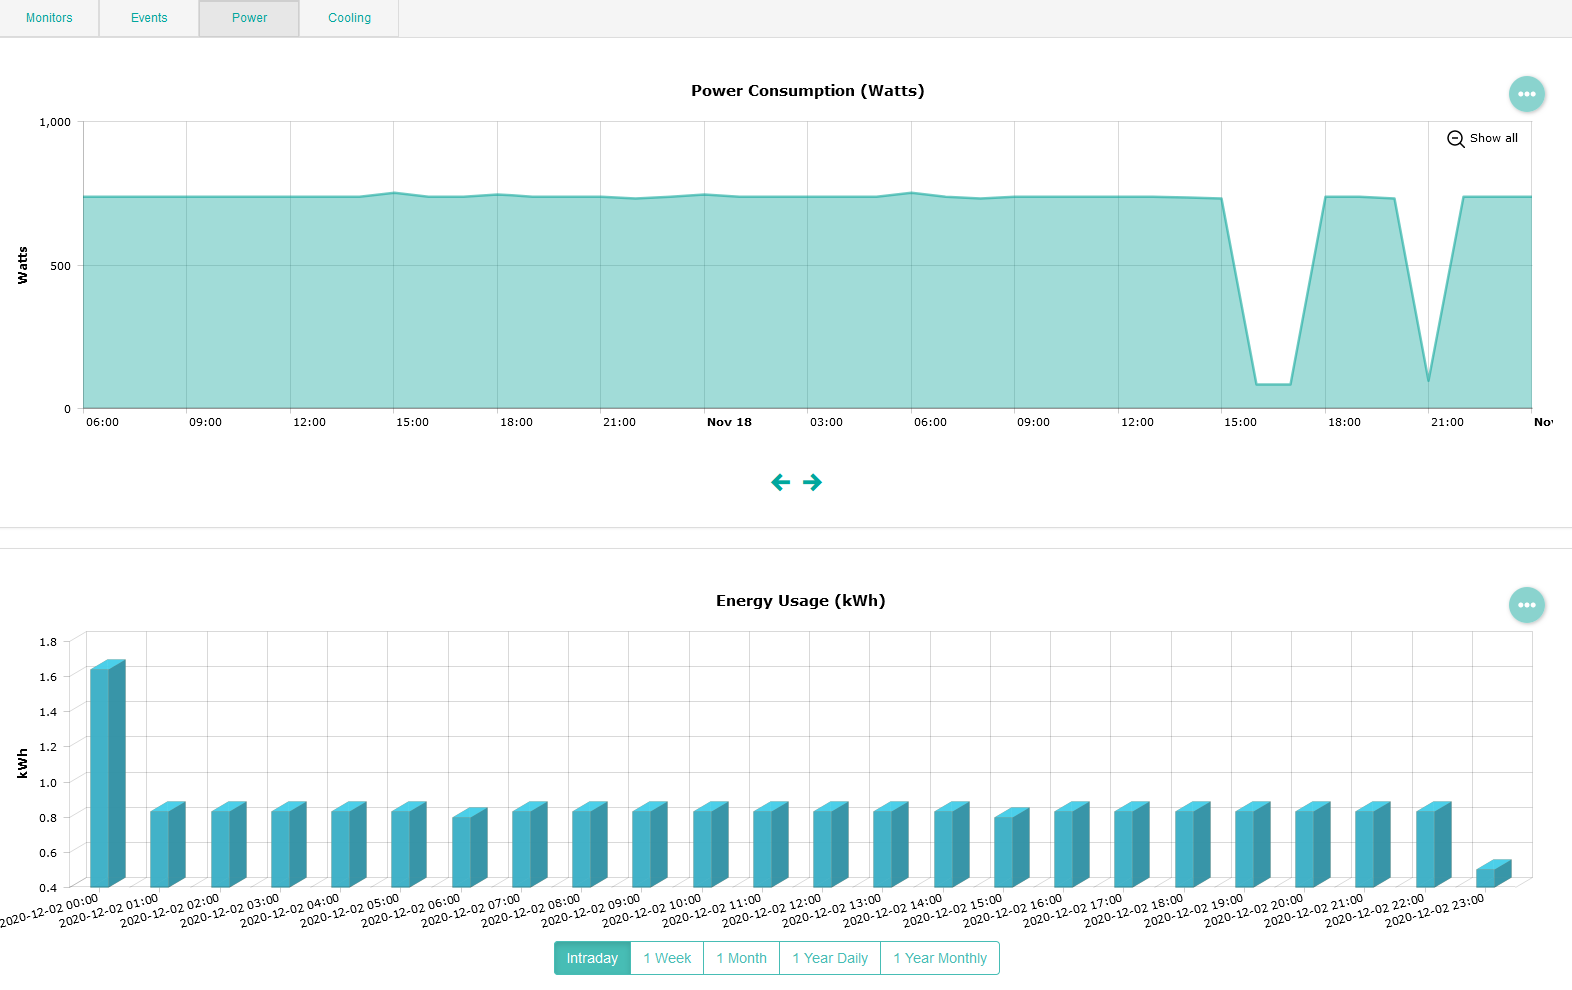
The Power tab provides a graph of the Power Consumption and the Energy Usage data collected for the selected hardware device.

Use the

Cooling Tab
The Cooling tab provides a graph of the Heating Margin (degrees below warning) and the Temperature data collected for the selected hardware device.
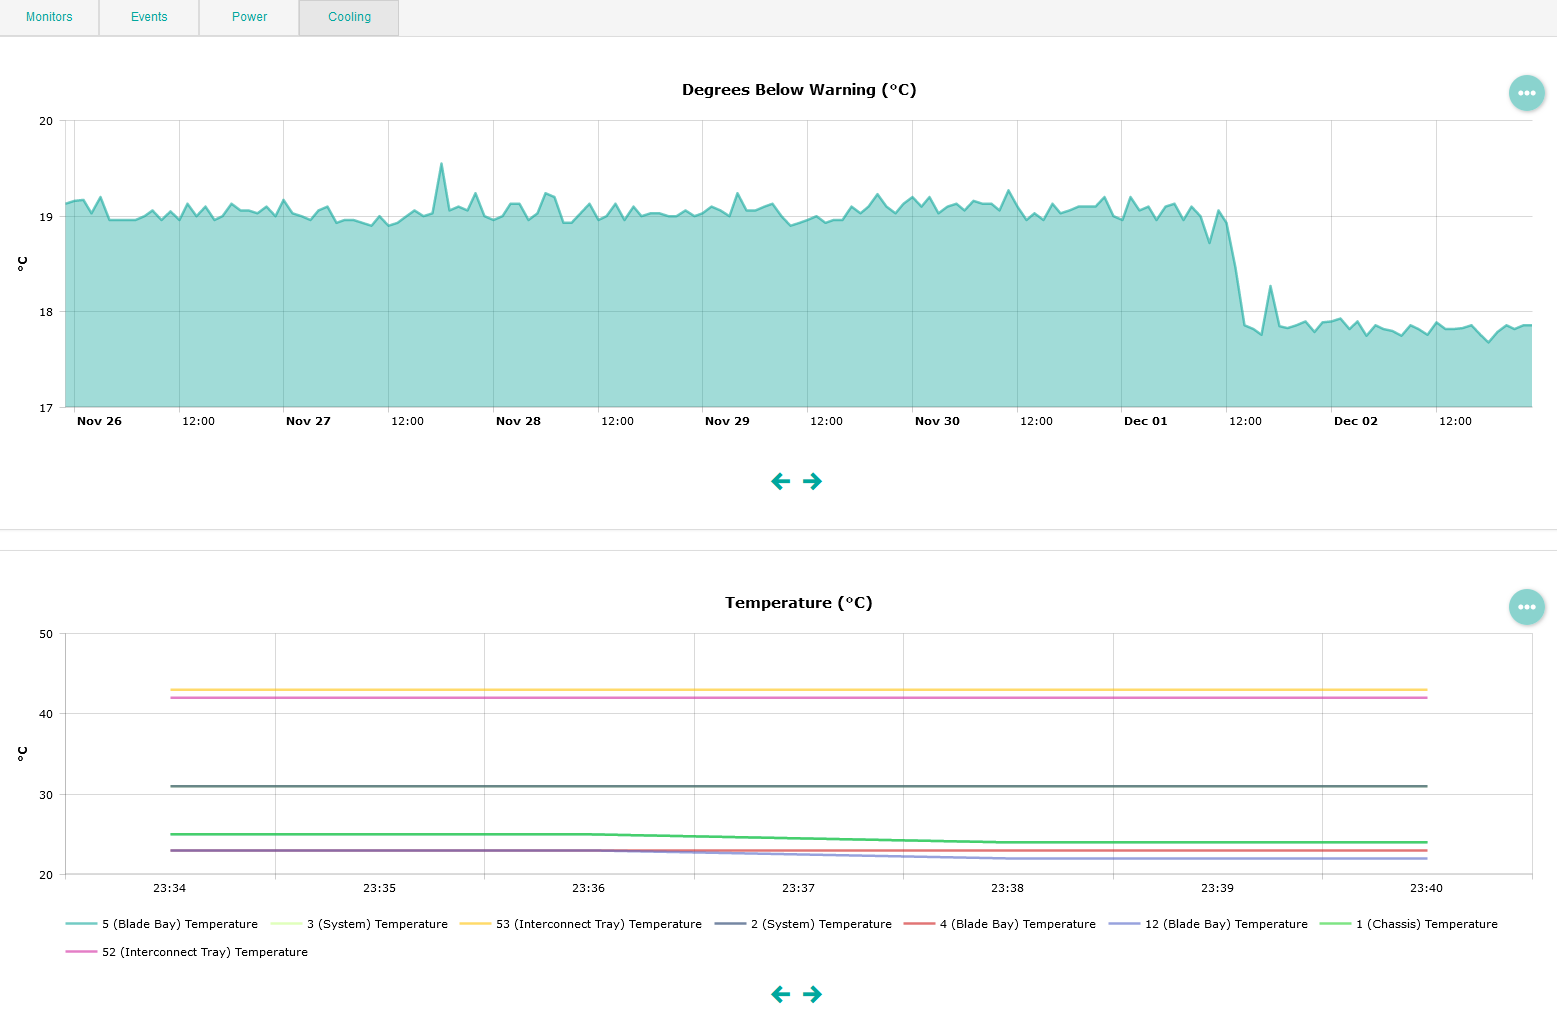
Use the arrow buttons located at the bottom of the graph to navigate through the time range. Pass your pointer over any area of the graph to display details about the collected values or select a specific area in the graph to zoom in. To restore normal view, click

Use the

Green IT Menu
The Green IT menu is automatically displayed after you have installed and configured the TSPS Component of Hardware Sentry. It extends the Infrastructure Management Server component's features by offering new views and reports to help you efficiently monitor and manage the amount of energy required for operating your datacenter.
All the Green IT extension functionalities are distributed across the following sub-menus:
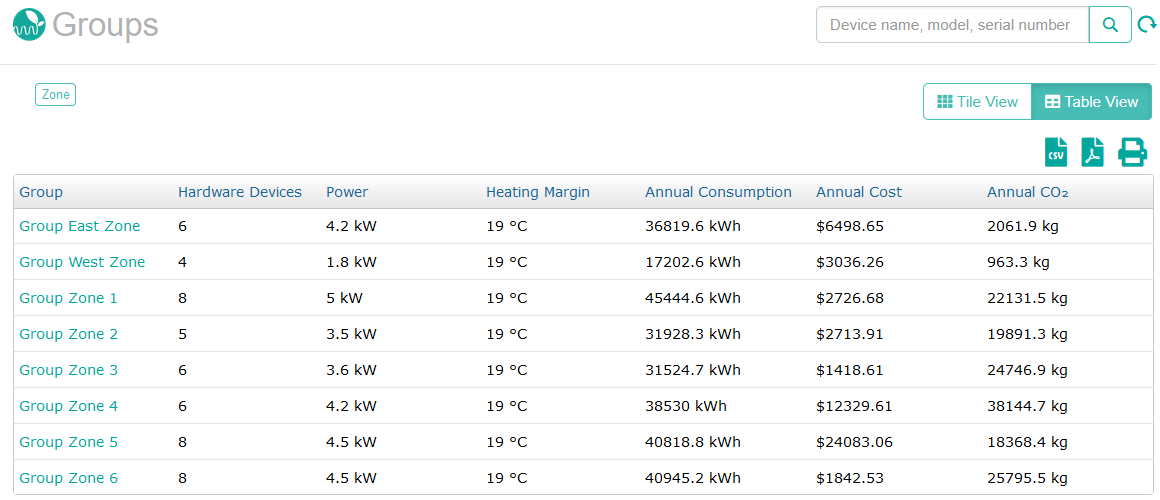
The content of these sub-menus can be displayed in two different views:
-
Tile View: Displays a dashboard summary of Applications, Groups, and Services information.
-
Table View: Lists Applications, Groups, and Services in a table sorted by name. Click another column heading to sort by that column.
Applications
The Applications page lists all the user-defined applications associated with hardware devices that are currently monitored by Hardware Sentry. It provides you with a visual representation of the business applications in your environment, and the ability to rapidly identify and diagnose issues. Refer to BMC Documentation for details on application management. Applications must be created from the Configuration > Applications page of the TrueSight console.
-
From the navigation pane, select Green IT > Applications.

-
Click an application to display detailed information about the application.
Application Details
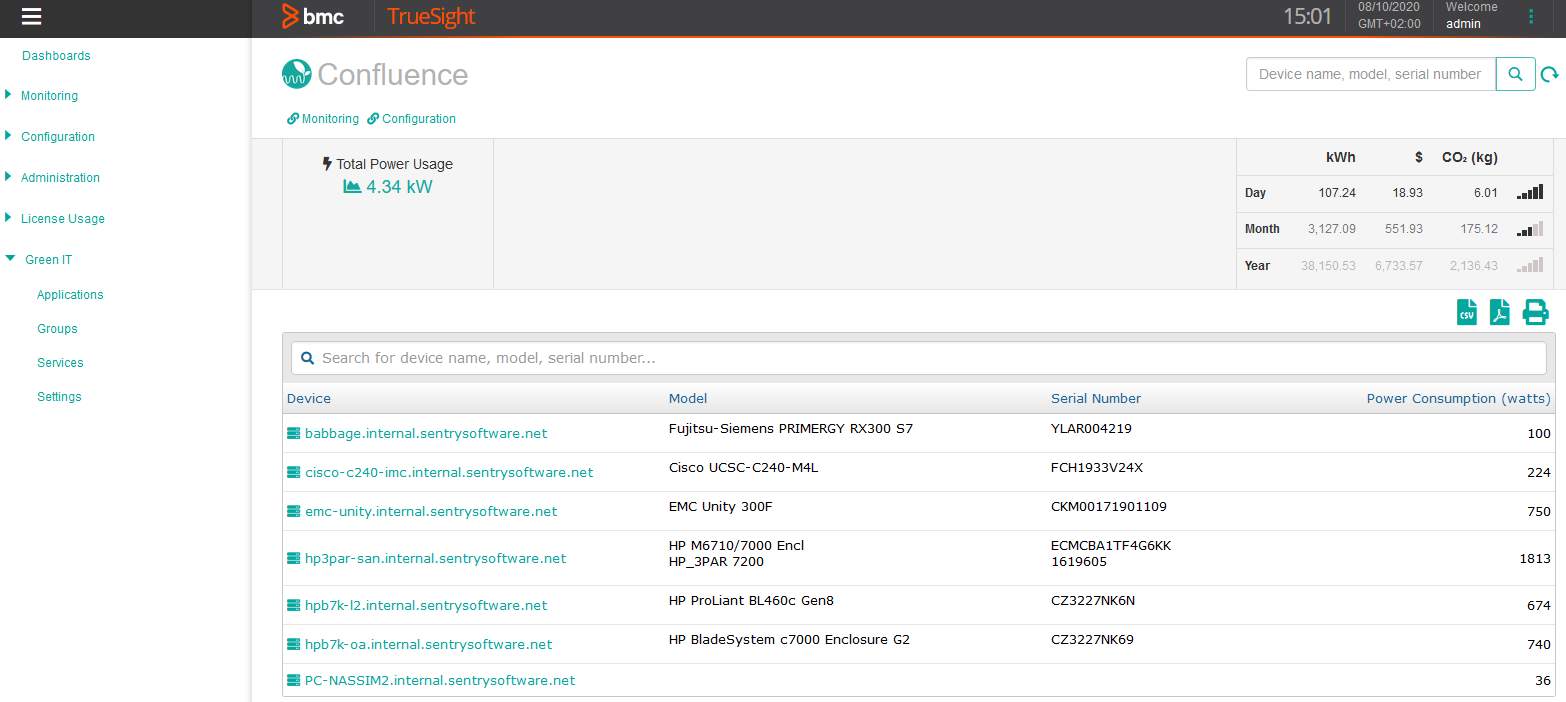
The Application Details page displays the list of associated hardware devices and reports power usage. It also provides real-time energy consumption, electricity costs and estimated carbon emissions analytics.
Total Power Usage
The Total Power Usage indicator shows the amount of kilowatts consumed by all the physical devices attached to the application since the last collect. It is calculated by aggregating the values of the Power Consumption parameter of each physical device reported by the Hardware Sentry KM Report Monitor.

Click the

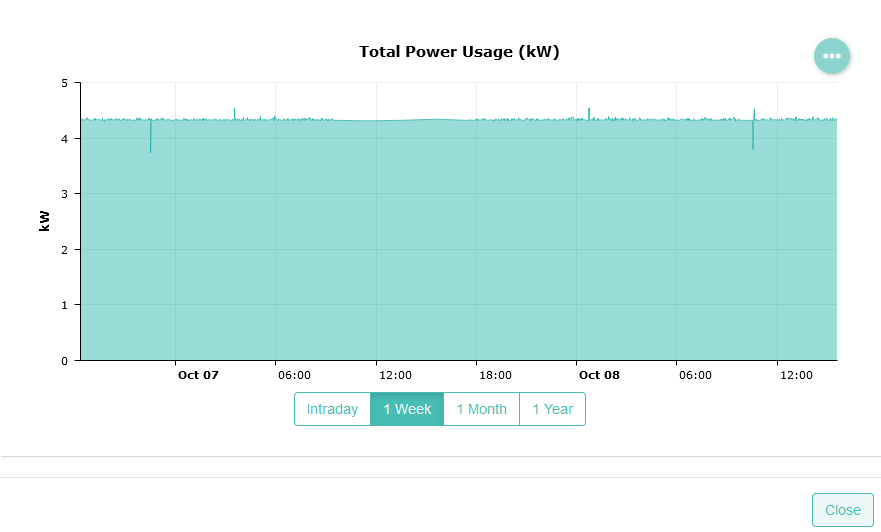
Use the

Energy Cost and CO₂ Emissions
The Energy Cost and CO₂ emissions summary reports on the consolidated energy usage in kWh for all the hardware devices attached to the application, by:
-
Day: consolidated kWh consumption and CO₂ emissions for all the hardware devices attached to the application in the last 24 hours,
-
Month: consolidated kWh consumption and CO₂ emissions for all the hardware devices attached to the application in the last 30 days, and
-
Year: consolidated kWh consumption and CO₂ emissions for all the hardware devices attached to the application in the last 12 months.
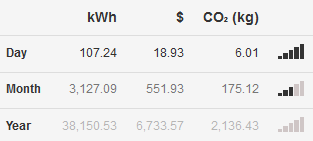
The Green IT Engine calculates the electricity consumption (kWh), the cost ($) and CO₂ emissions (kg) for an application, based on the values provided in the Global Settings or Groups Settings.

Devices List
This section of the Application Details page displays a list of the hardware devices that are associated with the Application along with its model, serial number and power consumption. The table is fully sortable by a simple click on a column header.


Click the name of a hardware device to be redirected to the Device Details page of the Hardware Devices menu for additional information about power consumption and temperature.
Groups
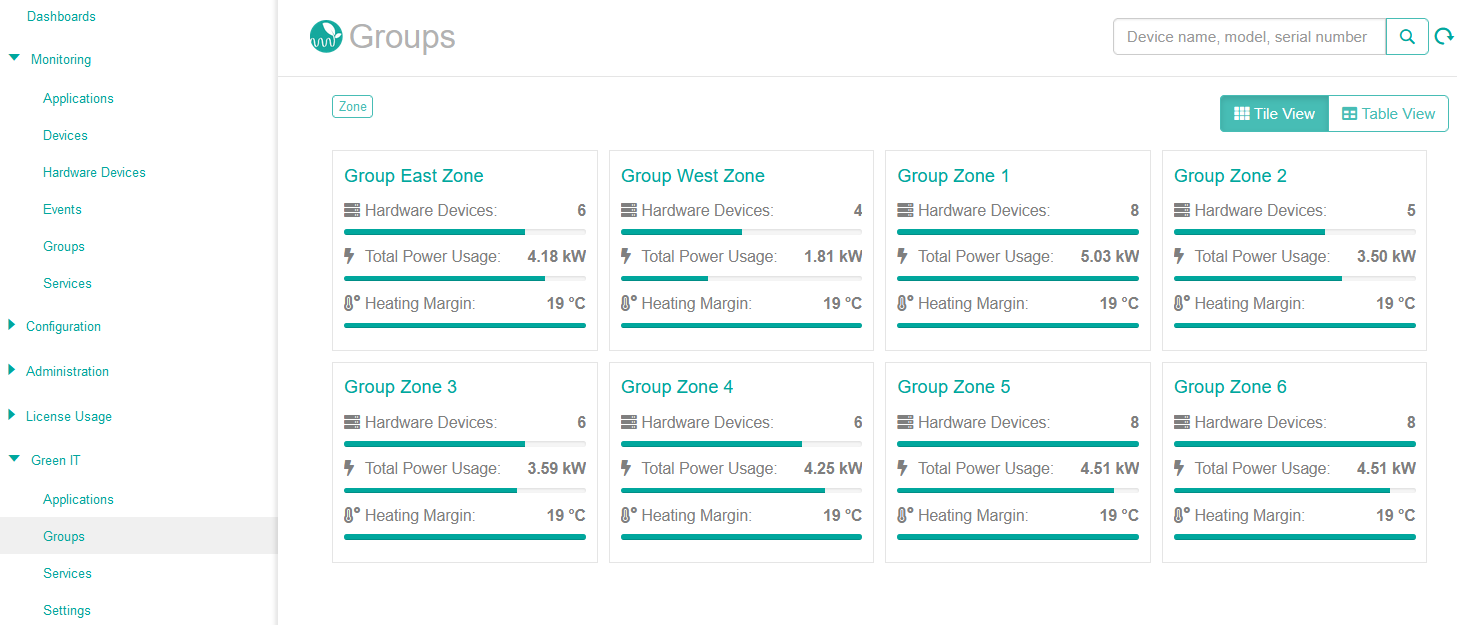
Groups contain user-defined sets of devices, determined by your business needs (For example, monitoring of devices and applications can be set up by building, department, zones, etc. ). Grouping your devices in TrueSight can make management significantly easier and save you configuration time. Refer to BMC Documentation for details on group management.
The Groups page lists all the user-defined groups containing hardware devices that are currently monitored by Hardware Sentry. Groups must be created from the Configuration > Groups page of TrueSight.
-
From the navigation pane, select Green IT > Groups.
-
Click group to display detailed information about the group.
Group Details
The Group Details page displays the list of associated hardware devices and reports power usage. It also provides real-time energy consumption, electricity costs and estimated carbon emissions analytics.

Total Power Usage
The Total Power Usage indicator shows the amount of kilowatts consumed by all the physical devices of the Group since the last collect. It is calculated by aggregating the value of the Power Consumption parameter of each physical device reported by the Hardware Sentry KM Report Monitor.

Click the

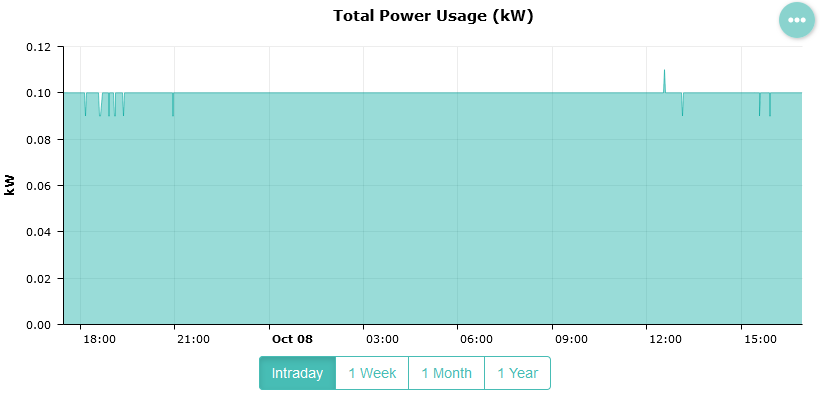
Use the

Heating Margin
Data centers are energy-intensive facilities. This energy is converted into heat that needs to be dissipated away from the equipment racks to maintain an optimal room temperature. The hardware devices temperature is then a critical parameter that needs to be closely monitored.
The Heating Margin indicator represents the number of degrees Celsius (°C) remaining before the temperature reaches the closest warning threshold. The Green IT engine collects 1 day of heating margin measurements for each hardware device and keeps the minimum (critical) value of all the hardware devices in the group.

Click the

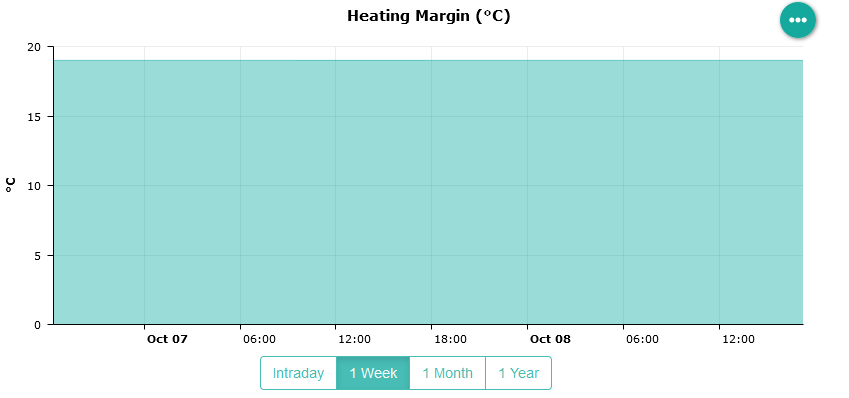
Use the

Some hardware devices do not expose their overall temperature and are therefore not included in the heating margin computation. To know what percentage of the monitored hardware devices is covered by the group's heating margin indicator, click

Ambient Temperature
Hardware equipment create a large amount of heat while operating. Monitoring the overall ambient temperature of a server room can prevent hardware overheating and disruptions in service. Therefore the temperature in the room should be closely monitored and maintained to an acceptable operational level.
Hardware Sentry Green IT calculates the ambient temperature per group based on:
-
The average ambient temperature sensor reading (in °C) of all the hardware devices in the group, and
-
The lowest temperature of all the temperature sensors in the hardware device, when ambient temperature sensors are not available

Click the

Use the

Energy Cost and CO₂ Emissions
With more and more businesses going online, servers and data centers are becoming one of the most valued assets in organizations. The demand for data and bandwidth is in constant growth, which leads to growing energy consumption and expenses. Measuring and analyzing electricity consumption is critical to keep control of energy usage and associated operating costs, measure the impact of companies activities on global warming and, establish action plans that reduce carbon emissions.
Hardware Sentry provides real-time visibility into your IT infrastructure's power usage, costs and carbon footprint.
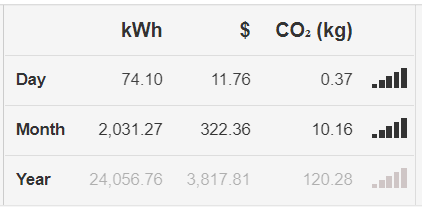
The Group Details page reports on the consolidated energy usage in kWh for all the hardware devices in the group, by:
- Day: consolidated kWh consumption and estimated CO₂ emissions for the group in the last 24 hours,
- Month: consolidated kWh consumption and estimated CO₂ emissions for the group in the last 30 days, and
- Year: consolidated kWh consumption and estimated CO₂ emissions for the group in the last 12 months.
The Green IT Engine calculates the electricity consumption (kWh), and the estimated cost ($) and CO₂ emissions (kg) for a group, based on the information provided in the Global Settings or Groups Settings.

Devices List
This section of the Group Details page displays a list of the hardware devices that belong to the Group along with their model, serial number, power consumption and heating margin. The table is fully sortable by a simple click on a column header.


Click the name of a hardware device to be redirected to the Device Details page of the Hardware Devices menu for additional information about power consumption and temperature.
Services
A service in the context of Infrastructure Management consists of a group of applications, middleware, security, storage, networks and, other supporting infrastructure that comes together to enable a comprehensive, end-to-end business process, transaction, or exchange of information.
-
From the navigation pane, select Green IT > Services.

-
Click a service to display detailed information about the service.
Service Details
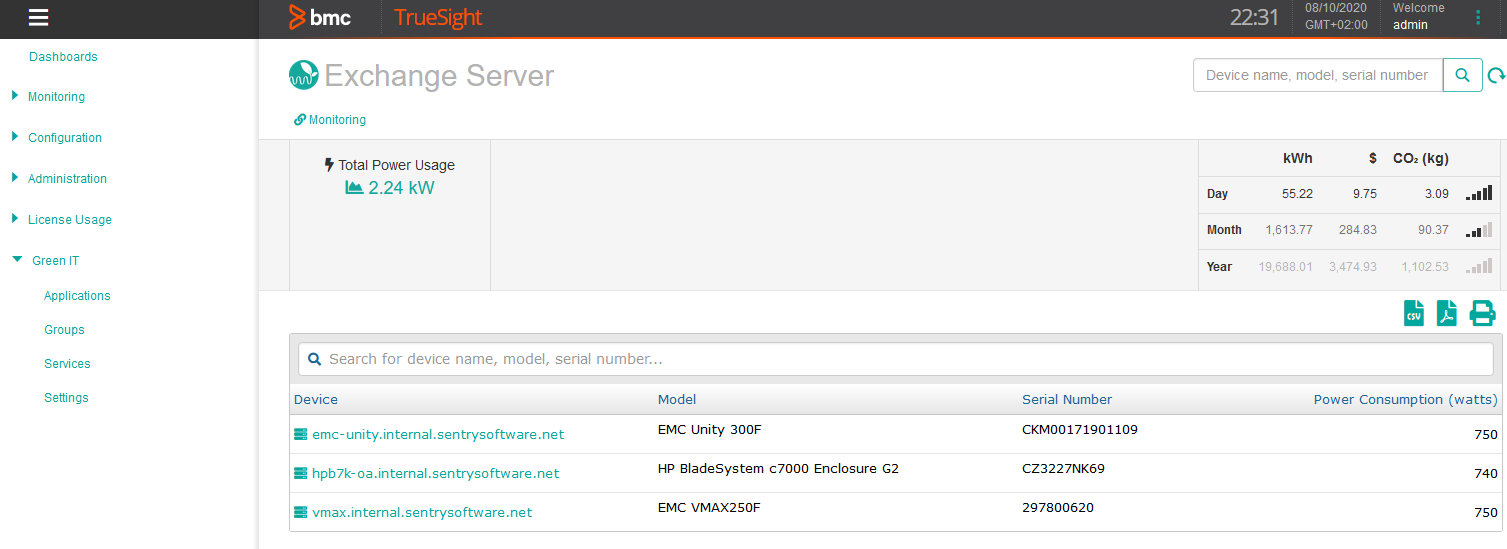
The Service Details page displays the list of associated hardware devices and reports power usage. It also provides real-time energy consumption, electricity costs and estimated carbon emissions analytics.
Total Power Usage
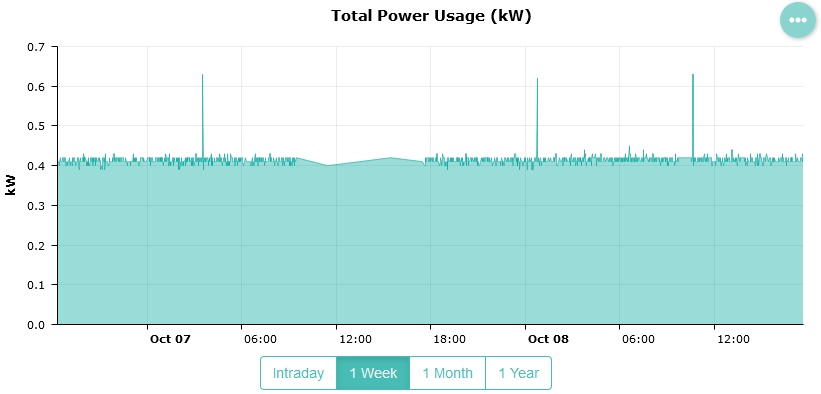
The Total Power Usage indicator shows the amount of kilowatts consumed by all the physical devices attached to the service since the last collect. It is calculated by aggregating the values of the Power Consumption parameter of each physical device reported by the Hardware Sentry KM Report Monitor.

Click the

Use the

Energy Cost and CO₂ Emissions
The Service Details page reports on the consolidated energy usage in kWh for all the hardware devices attached to the service, by:
-
Day: consolidated kWh consumption and CO₂ emissions for all the hardware devices attached to the service in the last 24 hours,
-
Month: consolidated kWh consumption and CO₂ emissions for all the hardware devices attached to the service in the last 30 days, and
-
Year: consolidated kWh consumption and CO₂ emissions for all the hardware devices attached to the service in the last 12 months.

The Green IT Engine calculates the electricity consumption (kWh), the cost ($) and CO₂ emissions (kg) for a service, based on the values provided in the Global Settings or Groups Settings.

Devices List
This section of the Service Details page displays a list of the hardware devices that are associated with the service along with their model, serial number and power consumption. The table is fully sortable by a simple click on a column header.


Click the name of a hardware device to be redirected to the Device Details page of the Hardware Devices menu for additional information about power consumption and temperature.