-
Home
- TrueSight
Troubleshoot HP Data Protector KM
This chapter describes the basic troubleshooting steps to follow before contacting Customer Support.
Performing the First Troubleshooting Steps
If you encounter issues while using HP Data Protector KM for PATROL, please complete the following steps. It will be easier to diagnose using the Monitoring Studio X Web UI or a PATROL Console.
- Look for error messages in the PATROL Console System Output Window (SOW) or in the KM log file
<PATROL_HOME>/log/HPO_<port>.logon the PATROL Agent system. - Check the KM Status Report from the file
<PATROL_HOME>/lib/HPO/tmp/km_status_<node-id>_<agent-port>.txton the PATROL Agent system. - Look for relevant PEM events. They include an Expert Advice, which provides details about the problem and some suggestions to resolve it.
- Verify that the latest version of the HP Data Protector KM is installed on the PATROL Agent system.
- Search the Sentry Software's knowledge base for solutions for this specific issue.
- Check the Most Common Issues.
Contacting Customer Support
If none of the above steps resolve the issue, please register a case for assistance. Before contacting our Customer Support, make sure that you have the following information available:
KM Status Report
Retrieve the KM Status Report from the file <PATROL_HOME>/lib/HPO/tmp/km_status_<node-id>_<agent-port>.txt on the PATROL Agent system. This report lists most KM problems and product information.
KM Debug
When you encounter an issue and wish to report it to Sentry Software, you will be asked to enable the Debug and provide the debug output to the Sentry Support team.
To enable the debug mode:
-
Click the action button

-
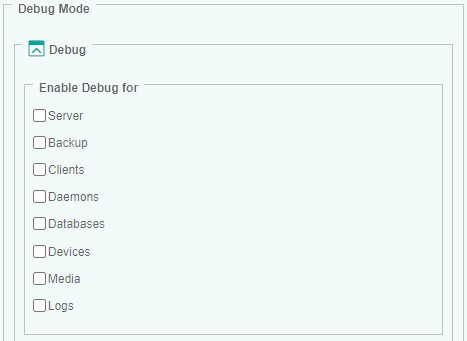
In the Data Protector Monitoring Settings panel, scroll down to the Debug section.
-
Select all the elements for which you want to obtain debug information.

-
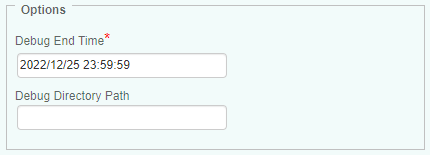
In the Options section, indicate:
-
when the system must stop logging debug information. The required format is:
YYYY/MM/DD HH:MM:SS -
where the debug file will be stored. The default path is:
<PATROL_HOME>/log
-
-
Click OK to validate.
When the debug end time is reached, a tar/zip file is automatically created under <PATROL_HOME>/log/ and can be sent to the Sentry Support team for help. It is also recommended to check the HPO_<port>.log file, stored in <PATROL_HOME>/log/, for any error.