-
Home
- Monitoring Studio Web Interface
Troubleshoot HP Data Protector KM
This chapter describes the basic troubleshooting steps to follow before contacting Customer Support.
Performing the First Troubleshooting Steps
If you encounter issues while using HP Data Protector KM for PATROL, please complete the following steps:
- Look for error messages in the KM log file
<PATROL_HOME>/log/HPO_<port>.logon the PATROL Agent system. - Check the KM Status Report from the file
<PATROL_HOME>/lib/HPO/tmp/km_status_<node-id>_<agent-port>.txton the PATROL Agent system. - Look for relevant PEM events. They include Expert Advice, which provides details about the problem and some suggestions to resolve it.
- Verify that the latest version of the HP Data Protector KM is installed on the PATROL Agent system.
- Search Sentry Software's knowledge base for solutions for this specific issue.
- Check the Most Common Issues.
- Reinitialize HP Data Protector KM.
Reinitializing HP Data Protector KM
When HP Data Protector KM stops working correctly or starts behaving in an unexpected manner (displays components as missing that you know are present, does not detect components as it should, stops collecting regularly, etc.), it is recommended to reinitialize the configuration and reconfigure the KM from scratch.
To reinitialize the KM
-
Click KMs > HP Data Protector or Monitored Data Protector Nodes in the HP Data Protector KM treeview and click the REINITIALIZE… button at the bottom of the page.
-
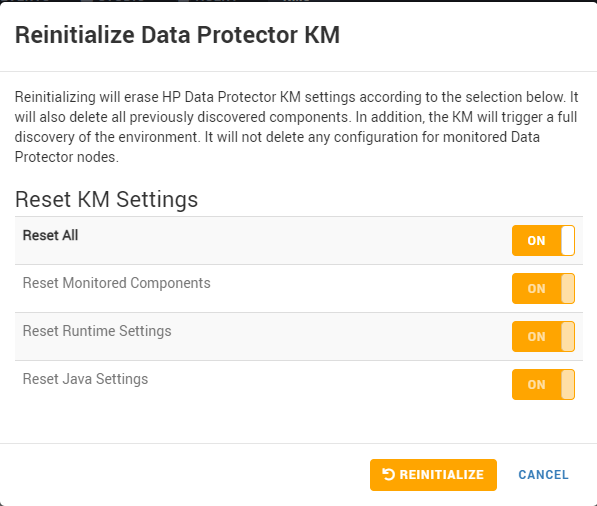
Select the options as per your specific needs:
Reset KM Settings:
- Reset All: Enables/disables the reset of all the listed settings except for Reset Alert Thresholds.
- Reset Monitored Components: Resets the monitoring of any component that has been disabled by user from the console.
- Reset Runtime Settings: Resets the KM runtime configuration stored under the PATROL configuration path
/Runtime/HPOto its initial settings. - Reset Java Settings: Removes the custom Java settings (path and credentials). The KM will try to automatically find a suitable JRE.

-
Click REINITIALIZE.
Contacting Customer Support
If none of the above steps resolve the issue, please register a case for assistance. Before contacting our Customer Support, make sure that you have the following information available:
KM Status Report
Retrieve the KM Status report by clicking the KM STATUS… button from KMs > HP Data Protector > <node-id> > Debug. This report lists most KM problems and product information. The same report can be accessed from the file <PATROL_HOME>/lib/HPO/tmp/km_status_<node-id>_<agent-port>.txt on the PATROL Agent system..
KM Debug
When you encounter an issue and wish to report it to Sentry Software, you will be asked to enable the Debug mode and provide the debug log to the Sentry Software Support team:
- Turn ON the DEBUG MODE from KMs > HP Data Protector > <node-id> > Debug to display the list of objects. By default, all objects will be turned ON.
- Turn OFF the objects you do not want to include in the log.
- In the Disable Debug Mode Automatically After field, enter the duration after which the debug mode will be turned off.
Once the debug settings are saved, the KM starts collecting debug data under <PATROL_HOME>/log from the next discovery or data collection cycle. If you wish to collect the debug during the initial discovery or initial data collection cycles, turn ON the Reload Data Protector KM on <node-id>.
During debug logging, the debug log files can be listed and viewed in the Debug Files section. Click REFRESH to see the latest debug log files. These files can be deleted selectively or all at once by clicking DELETE ALL, if they are not required.
The DEBUG MODE can be turned OFF manually anytime. When the debug mode is turned off (manually or automatically), a compressed file is then created under <PATROL_HOME>/log/. This file is listed in the Compressed Debug Files for Support section.