-
Home
- Helix
Configure Storage Analyzer
This chapter explains how to configure a connection to a supported endpoint to monitor and report storage performance and capacity metrics.
Create a Storage Analyzer Policy
Policies enable administrators to deploy configurations on PATROL Agents and monitoring solutions, such as Storage Analyzer, in an automated way. Policies are designed to define and configure monitoring criteria and apply them to selected PATROL Agents. The configuration criteria are automatically pushed to the PATROL Agents on which the policy is applied.
To create a monitoring policy:
-
Log on to the BMC Helix Operations Management console.
-
From the top menu, expand Configuration and select Monitor Policies.
-
In the Monitor Policies menu, click Create.
-
In the Create Monitoring Policy page, specify the monitoring policy properties:
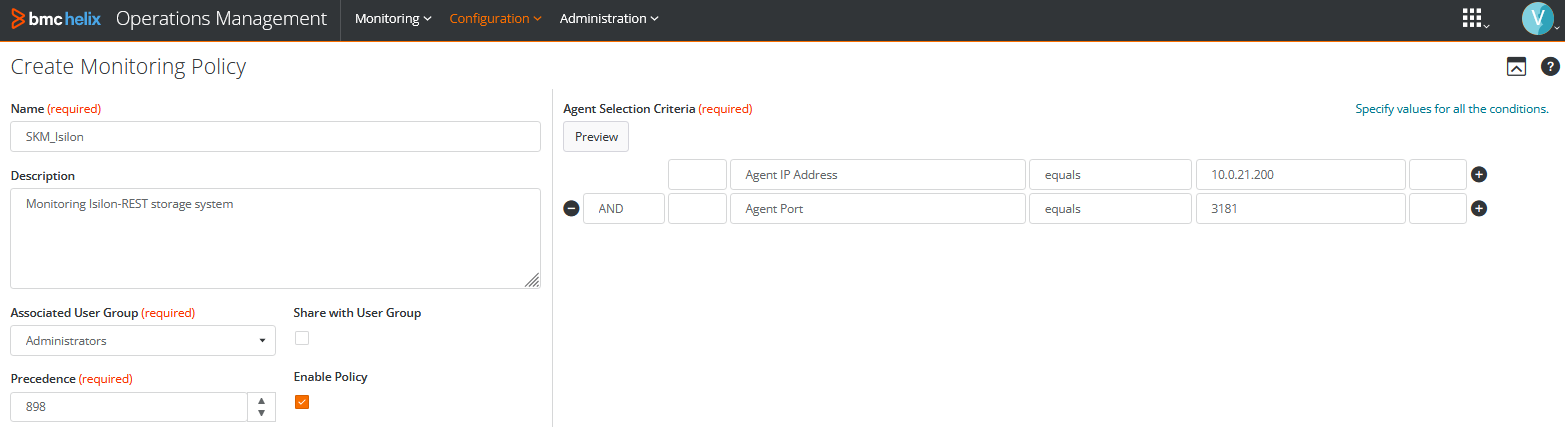

Step 1 - Define the General Properties
| Property | Description |
|---|---|
| Name | Enter the name of the policy. The policy name must be unique. In an environment with tenants, the policy name must be unique for a single tenant. It is a mandatory field. |
| Description | (Optional) Provide a brief description about the policy. |
| Associated User Group | Provide the name of the user group that is associated with the PATROL Agents as defined in the Authorization Profile or in the PATROL Agent ACLs. The policy is applicable to these PATROL Agents. |
| Share with User Group | Specify whether this policy is to be shared with the users across the associated user group or not. This property can be viewed in READ-ONLY mode by other users of the associated user group. Only the owner of the policy can modify this property. |
| Precedence | Priority of the policy. Based on the precedence number that you configure, the configuration is applied to the PATROL Agents. Refer to BMC Helix documentation for more information about precedence. |
| Enable Policy | Indicates whether the policy is enabled or disabled. By default, the policy is enabled. If you disable a policy when you create it, the policy configurations are not applied to the PATROL Agents. If you disable any existing policy, the policy configurations are removed from the PATROL Agents where the policy was applied. |
Step 2 - Select the PATROL Agents
Define conditions to select the PATROL Agents on which you want to apply the policy:
- Select a property.
- Select an operator to create the condition. The available operators depend on the property that you select.
- Specify a value for the selected property.
- (Optional) To add more than one condition, click the

- (Optional) To group the conditions, use the parentheses and Boolean operators from their corresponding lists.
- Click Save to validate the creation of the policy.

Configure the Storage Analyzer Monitor Properties
Once the Storage Analyzer policy is created and configured, Storage Analyzer is loaded by the Agent. Then, the Storage Endpoint Type must be properly configured to start collecting performance and capacity data.
To configure the Storage Endpoint Monitor Type:
-
Create a policy or edit an existing policy.
-
Click the Monitoring tab.
-
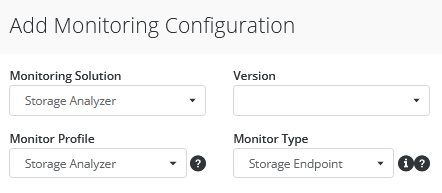
Click Add Monitoring Configuration to configure the Monitor Type properties:
-
From the Monitoring Solution menu, select Storage Analyzer.
-
From the Version menu, select the required version. The Monitor Profile and Monitor Type information are automatically selected.
-
Click Add in the Storage Configuration section to configure monitoring, connection and advanced settings for the endpoint you wish to monitor.

Monitoring Settings
The Endpoint Settings section allows you to define the component you wish to monitor.

In the Endpoint Settings section, provide the following information:
- Internal ID: Enter an ID that will identify the endpoint.
- Hostname/IP Address: Enter the hostname or the IP address of the endpoint you wish to monitor.
- From the Storage Intelligence Adapter drop-down list, select the adapter that matches the endpoint platform. This will determine which Storage Intelligence Adapter Storage Analyzer will use to query and retrieve performance and capacity metrics from the endpoint. If Other SI Adapter is selected, enter the Storage Intelligence Adapter filename in the Other Storage Intelligence Adapter field below (the filename is case insensitive).
- Hardware Monitoring: Select to enable the monitoring of the hardware components for the selected storage platform via Hardware Sentry KM. This option is only available when Hardware Sentry KM for PATROL version 11.0.01 or higher is installed and loaded on the PATROL Agent and if the selected Storage Intelligence Adapter contains the hardware connector details. Refer to Install the KM for details.
- (Optional) Enter the FQDN to associate the system with another endpoint in Helix. The FQDN uniquely distinguishes an endpoint from any other system and ensures that an endpoint monitored via their management cards or through controllers, for example, is appropriately identified.
Storage Analyzer comes with a library of Storage Intelligence Adapters (*.si files) describing how to discover endpoints and retrieve capacity and performance data for all their components. Make sure to have correctly installed the latest Storage Intelligence Library.
Connection Settings
The connection settings are mandatory to establish a connection between Storage Analyzer and the monitored endpoint.

Provide the following information:
- Enter the Username, Password and Token to establish the connection with the endpoint.
- Specify the Port Number. By default, the port is set to 5989. Refer to the Storage Intelligence Library to find the default port number used by a specific system.
- For encrypted connections, check the Encryption option.
Advanced Settings
The advanced settings allow you to fine-tune the monitoring settings of an endpoint to better suit your specific needs.

Provide the following information:
- Discovery Interval: Storage Analyzer periodically performs discoveries to detect new components in your monitored endpoint. By default, the solution runs a discovery every 60 minutes, but you can customize this interval to match your specific needs. Enter the frequency (in minutes) of the discovery process.
- Polling Interval: Storage Analyzer polls the monitored endpoint to collect performance and capacity data. By default, the polling interval for data collection is set to every 2 minutes. Enter the interval at which the solution must poll the monitored endpoint to collect data.
- Engine Timeout: Specify the time in minutes after which the engine should be stopped when querying the endpoint
- Query Timeout: Specify the time in minutes allocated to individual queries.
- Disable Volume Monitoring: Check this option to disable discovery and data collection for volumes on the endpoint. Volumes will no longer appear in the Console.
- Hide Volume Instances: Uncheck this option to create individual instances for each volume discovered on the endpoint. For performance and scalability reasons, it is recommended to keep this option enabled.
Configure Alert Messages Settings
Configuring the Alert Messages consists in defining specific actions to be executed when a storage problem is detected, and customizing the way notifications are conveyed.

-
Expand the Alert Messages section in the Storage Configuration > Global Settings pane.
-
Define the alert action you wish Storage Analyzer to perform Upon a Storage Problem and Upon a Collection Problem:
- A Specific PATROL Event (Default)
- A STD 41 PATROL Event
- No Event
-
The Enable Annotations option makes the solution annotate the parameter’s graph with a comprehensive report of the problem. Annotations are enabled by default. Uncheck the option if you do not want graphs to be annotated.
-
The Write to This LOG File option lets you to enter the path of a log file where Storage Analyzer will write information about the problem.
-
Click OK to save your settings.
Edit a Monitoring Policy
- Log on to the BMC Helix Operations Management console.
- In Configuration menu, select Monitor Policies.
- In the Monitor Policies page, locate the monitoring policy you wish to modify, click its action button

- In the Edit Monitoring Policy page, locate the monitoring configuration you wish to modify and click its action button
- Customize the configuration.
- Click Save to apply your changes to the selected PATROL Agent(s).

Create and Manage Alarm and Event Policies
Refer to the BMC Helix Operations Management documentation to learn how to create and manage Alarm Policy and Event Policy.
To learn how to receive and manage PATROL events generated by Sentry Software's KMs in BMC Helix Operations Manager(BHOM), read the Handling PATROL Events Generated by Sentry KMs in BMC Helix Operations Manager article on Sentry Software's Web site.