-
Home
- Standalone with Monitoring Studio
Operate Storage Analyzer KM for PATROL
This chapter describes the most common operations that can be performed with Storage Analyzer via the Web console.
Console Overview
The PATROL Agent runs Knowledge Modules (KMs). KMs create instances (Monitors) to represent the systems, devices, and objects they monitor. For each monitored instance (system), parameters are collected at a regular interval to assess its health and performance. The Web console shows all monitored instances and collected parameters, and their current status.
The default view (when you select the top-level KMs icon in the treeview) lists all the KMs installed and running on the PATROL Agent and the main instances they have created (root instances).
The REFRESH button triggers a refresh of the data displayed on the page. It does not trigger a collect on the Agent.
The TRIGGER DISCOVERY button allows you to trigger a discovery for all the installed KMs.
The AGENT INFORMATION button redirects you to the page that lists all the PATROL Agent current settings.
The AGENT RESTART button allows you to restart the PATROL Agent immediately.
Storage Analyzer Instance
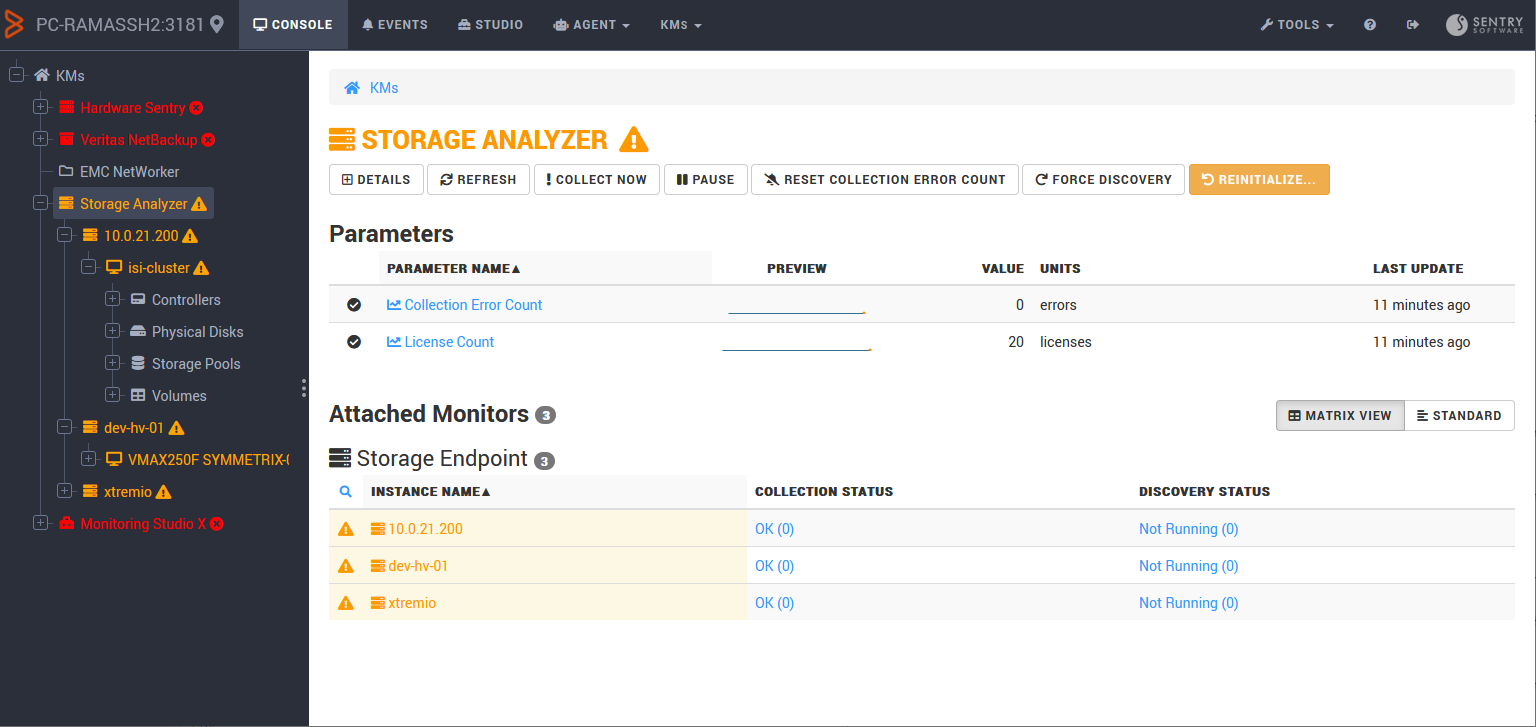
When you select Storage Analyzer in the KM page or the treeview, the Web console displays the monitored endpoints (Attached Monitors) and their related collected parameters.
Attached Monitors can be displayed in two ways:
- Matrix View: All instances of the same class are represented in a table, with the values of the collected parameters in different columns. This view allows you to have a quick overview of an entire class of Monitors.
- Standard View: All instances and their collected parameters are listed at once, with a bar representing their Sub-Monitors. This view allows you to easily navigate the tree of all monitored instances.
Several action buttons are also available to facilitate access to additional information and to perform common operations:
-
The DETAILS button displays additional information about the selected instance (Monitor). If available, the list of properties includes a link to the online help of the corresponding class.
-
The REFRESH button triggers a refresh of the data displayed on the page. It does not trigger a collect on the PATROL Agent.
-
The COLLECT NOW button triggers an actual collect on the PATROL Agent for the selected instance. If no collector is available for the selected instance, the action takes place on its parent, and so on. The display is automatically refreshed after 5 seconds. If the collection process takes more than 5 seconds to complete, the view remains unchanged. Make sure to check the Last Update field in the parameters table to see whether they have been updated already. Other action buttons may become available depending on the class and the KM to which the selected instance belongs.
-
PAUSE and RESUME buttons pause and/or resume the collect on all the objects managed by the Web console.
-
The RESET COLLECTION ERROR COUNT button acknowledges and reset to zero all Collection Error Count parameters in alert.
-
The FORCE DISCOVERY button triggers a full discovery of your monitoring environment. By default, Storage Analyzer performs a discovery every hour for all the monitored endpoints to detect new and missing components. The discovery process is optimized to discover all objects in parallel.
-
Detailed information about the REINITIALIZE… option is available in the Troubleshooting section.

Additional action buttons are available at the endpoint level.
-
The REMOVE button removes the endpoint from the monitoring process.
-
The EDIT button redirects you to the endpoint configuration page (KMs > Storage Analyzer menu).
-
The REDISCOVER button triggers a full discovery on the Agent for the selected endpoint.
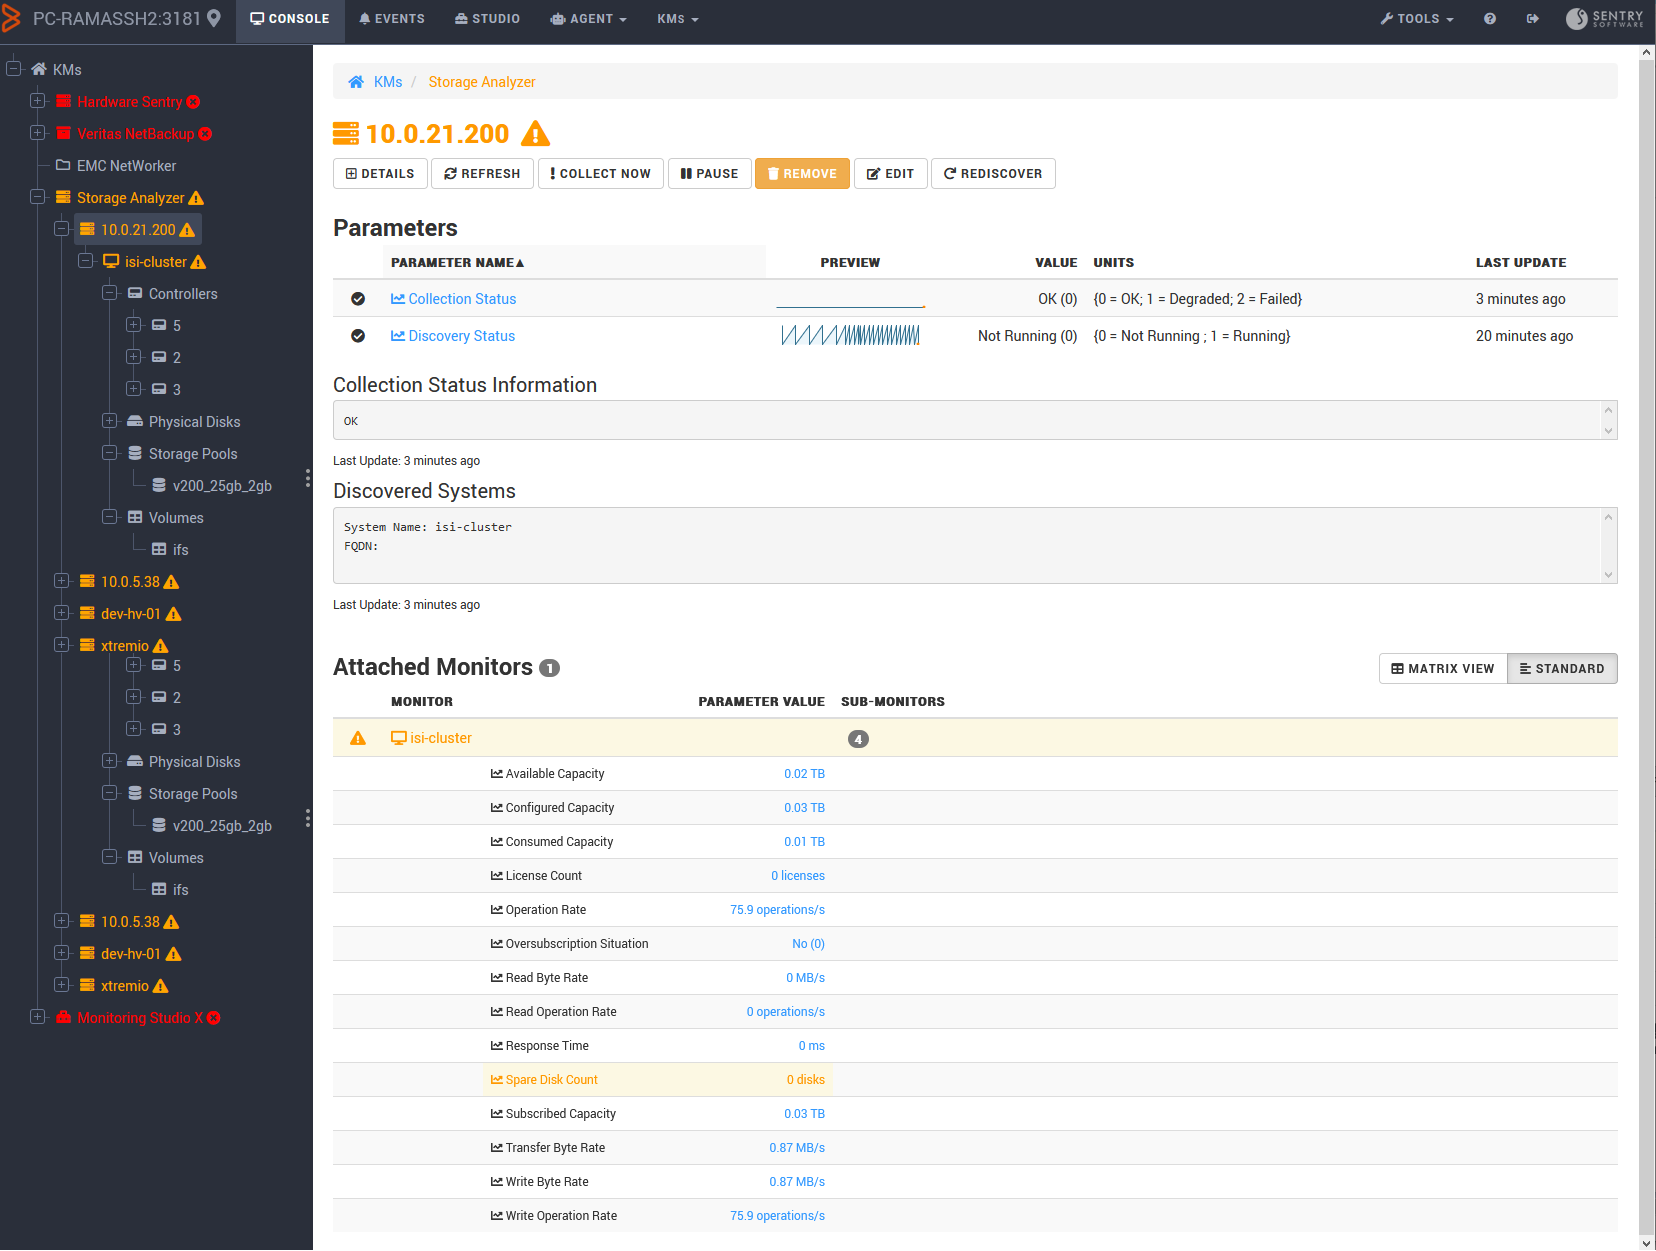

Drill down to the component and parameter levels to get detailed information and graph representation about the collected capacity and performance data.