-
Home
- Standalone with Monitoring Studio
Troubleshoot Storage Analyzer
This chapter describes the basic troubleshooting steps to follow before contacting Customer Support.
Performing the First Troubleshooting Steps
If you encounter issues while using Storage Analyzer KM for PATROL, please complete the following steps:
- Verify that the latest version of the Storage Intelligence Library is installed on the managed system.
- Search the Sentry Software's knowledge base for solutions for this specific issue.
- Reinitialize Storage Analyzer.
Contacting Customer Support
If none of the above steps resolve the issue, please contact Customer Support for assistance. Before contacting our Customer Support, make sure that you have the following information available:
Product Information
Retrieve the Storage Analyzer version from the Storage Analyzer home page of the KMs menu Get detailed information about the KM from the Storage Analyzer page of the Console menu
Enabling Debug
When you encounter an issue and wish to report it to Sentry Software, you will be asked to enable the Debug mode and provide the following files to the Sentry Software Support team:
SKM_<session>_<endpoint-id|global>_debug_km_<port>.log: logs the discovery and collect operations of the monitored endpointSKM_<session>_CollectionHub_<psl>_<port>.log: logs the operations of the Collection Hub, the interface between PSL and the Java engineSKM_<session>_CollectionHub_<java>_<port>.log: logs the operations of the Java engine of the Collection Hub.
Note:<session> is the session number suffixed with a random color (e.g.: 1-Spring-Green, 11-Cyan, etc.)

From there, you can either enable debug for all your endpoints by clicking ENABLE ALL or for some specific endpoints. In that case, expand the ENDPOINTS sub-section and turn ON debug for the hosts of your choice.
Then, indicate the time after which the debug mode will be disabled.
By default, all debug logs generated during a session are compressed to a single file when the time specified is reached or when debug is manually disabled (SKM_<session>_debug_<hostname>_<port>.tar.gz on UNIX/Linux, SKM_<session>_debug_<hostname>_<port>.zip on Windows. <hostname> and <port> correspond to the PATROL Agent hostname and port). If you do not want an archive to be created, turn OFF the Compress Debug Files option.
Debug files are saved to the $PATROL_HOME/log (on UNIX/Linux) or the %PATROL_HOME%\log (on Windows) directory. You can also download them directly from the Web Console, under Debug Files.
Reinitializing Storage Analyzer
When Storage Analyzer stops working properly or starts behaving in an unexpected manner (displays components as missing that you know are present, does not detect components as it should, stops collecting regularly, etc.), it is recommended to reinitialize the configuration and let the KM re-start monitoring from scratch.
To reinitialize the KM
-
Select KMs > Storage Analyzer > KMs Settings > Reinitialize
-
Click the Reinitialize… button.
-
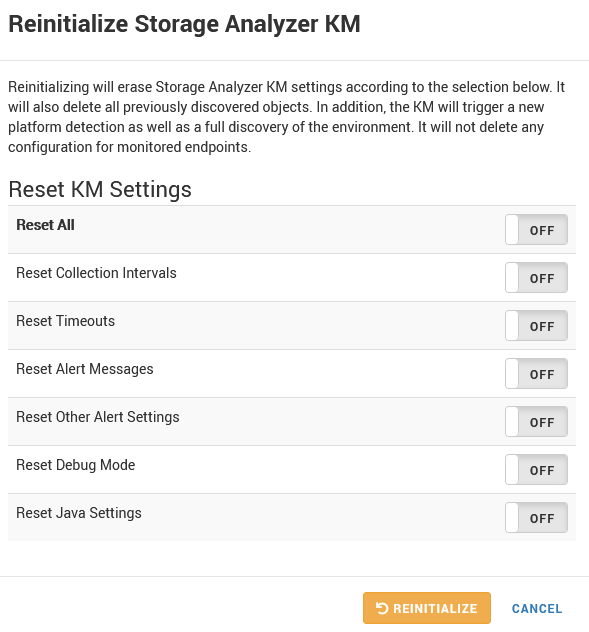
Select the options as per your specific needs:
Reset KM Settings:
- Reset All: Enables/disables the reset of all the listed settings except for Reset Alert Thresholds.
- Reset Collection Intervals: Removes all user-defined frequencies for discovery and polling processes to their default values (respectively 1 hour and 2 minutes).
- Reset Alert Messages: Removes all manually set Alert Messages and reverts to basic default messages. i.e. Trigger a PATROL event and Annotate a parameter graph.
- Reset Other Alert Settings: Reverts missing device alert settings to the default Storage Analyzer values.
- Reset Debug Mode: Deactivates the debug mode when it was enabled and resets settings to default.
- Reset Java Settings: Removes the custom Java settings (path and credentials). The KM will try to automatically find a suitable JRE.
-
Click Reinitialize.

SI Launcher
This tool should be used upon request of a Sentry Software Support Representative only.
The SI Launcher is designed to instantly perform discoveries and collects on a specific supported storage platform (.si). This can be particularly useful when Sentry Software Support needs to get information about your monitoring environment without waiting for a debug log.
Prerequisites
- Java 1.8 or higher
Silicium-launcher-tool<version>.jar. This file is automatically installed along with Storage Analyzer.- The .si files provided with the Storage Intelligence Library:
- Download the Storage Intelligence Library from the Sentry Software Website and unzip it in a dedicated folder (typically where the
Silicium-launcher-tool<version>.jaris stored), or - Copy the .si files from the folder created upon the Storage Analyzer installation process, typically:
\Patrol3\lib\sifor Windows systems or/opt/bmc/Patrol3/lib/sifor UNIX/Linux systems.
- Download the Storage Intelligence Library from the Sentry Software Website and unzip it in a dedicated folder (typically where the
SI Launcher Execution
Launch a Command Prompt from the folder where Java is stored and enter:
java -jar silicium-launcher-tool-<version>.jar -f <.si name> --url <url of the storage system including its port> -u <username>.
Example: java -jar silicium-launcher-tool-1.9.00.jar -f DellEMC-Isilon-REST.si --url https://host:8080 -u admin.
Mandatory Arguments
-f= name of the .si file corresponding to the storage system (ex: DellEMC-Isilon-REST.si).--url= url of the storage system including its port (ex: https://host:8080).-u= username (ex: admin).-a service.period= internal engine collection interval used for the collect job cycle). Default is 300000 milliseconds (5 minutes).
Optional Arguments:
-j= Job (request) type, that is -d(discovery), -f(full collect), -p(partial collect). When the job type is not specified the SI Launcher executes a discovery and a full collect.-?= displays the list of valid arguments and some examples.
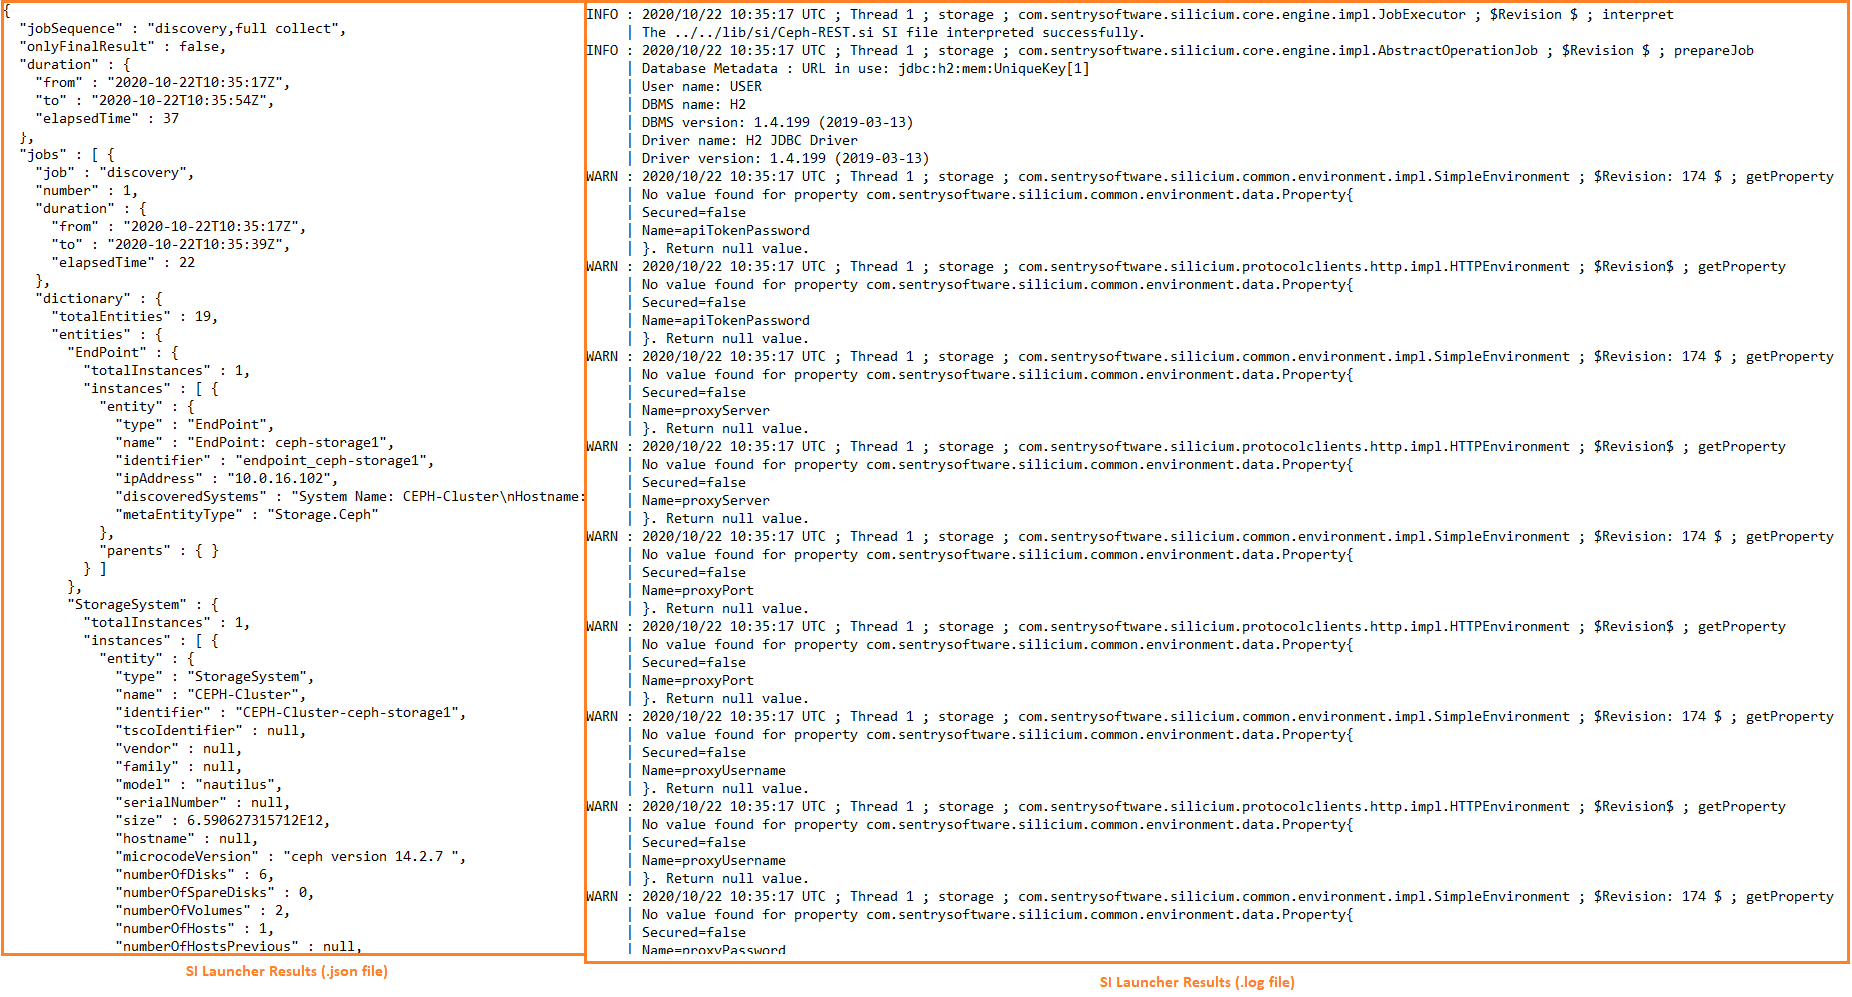
SI Launcher Results
By default, the SI Launcher creates a zipped file containing:
-
an
.sifile that is the storage platform file on which the command is executed. -
a
.logfile that provides details about the command execution (the .log file is not generated if the -debug argument is set to “none”). -
a
.jsonfile that contains the data retrieved by the command.