-
Home
- TrueSight
Configure Storage Analyzer
This chapter explains how to configure a connection to a supported endpoint to monitor and report storage performance and capacity metrics.
Create a Storage Analyzer Policy
Policies enable administrators to deploy configurations on PATROL Agents and monitoring solutions, such as Storage Analyzer, in an automated way. Policies are designed to define and configure monitoring criteria and apply them to selected PATROL Agents. The configuration criteria are automatically pushed to the PATROL Agents on which the policy is applied.
By default, tenant administrators have full access to all policies in their realm (tenant). Certain policy management operations can only be performed by the owner of the policy. For more information about the different policies, see the Policy Management chapter of the BMC TrueSight documentation.
To view the Infrastructure Policies page, in the navigation pane of the TrueSight console, expand Configuration and select Infrastructure Policies.
To create a monitoring policy:
-
Log on to the TrueSight console.
-
In the navigation pane, expand Configuration and select Infrastructure Policies.
-
In the Infrastructure Policies page, ensure that the Monitoring tab is selected and click Create Policy.
-
In the Create Monitoring Policy page, specify the monitoring policy properties:
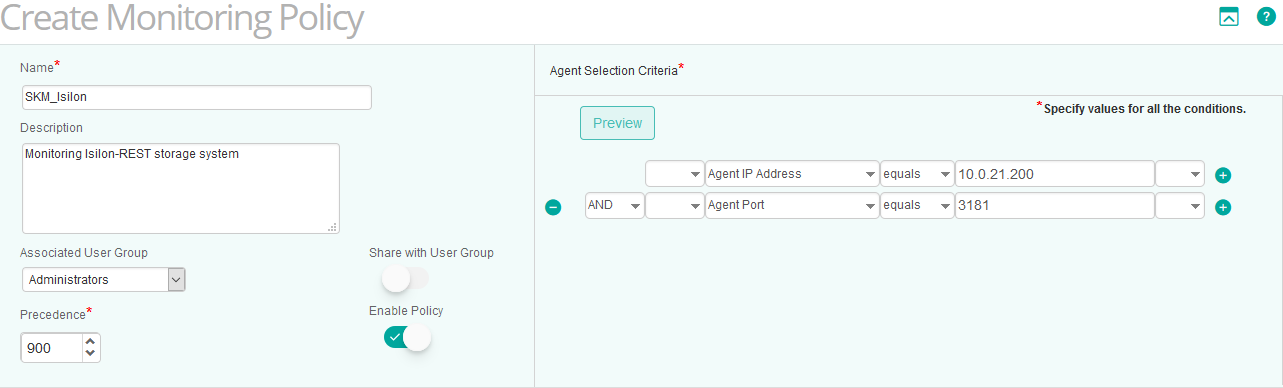

Step 1 - Define the General Properties
| Property | Description |
|---|---|
| Name | Enter the name of the policy. The policy name must be unique. In an environment with tenants, the policy name must be unique for a single tenant. It is a mandatory field. |
| Description | (Optional) Provide a brief description about the policy. |
| Associated User Group | Provide the name of the user group that is associated with the PATROL Agents as defined in the Authorization Profile or in the PATROL Agent ACLs. The policy is applicable to these PATROL Agents. |
| Share with User Group | Specify whether this policy is to be shared with the users across the associated user group or not. This property can be viewed in READ-ONLY mode by other users of the associated user group. Only the owner of the policy can modify this property. |
| Precedence | Priority of the policy. Based on the precedence number that you configure, the configuration is applied to the PATROL Agents and the Infrastructure Management servers. Refer to BMC TrueSight documentation for more information about precedence. |
| Enable Policy | Indicates whether the policy is enabled or disabled. By default, the policy is enabled. If you disable a policy when you create it, the policy configurations are not applied to the PATROL Agents and the Infrastructure Management Servers. If you disable any existing policy, the policy configurations are removed from the PATROL Agents and the Infrastructure Management servers, where the policy was applied. |
Step 2 - Select the PATROL Agents
Define conditions to select the PATROL Agents on which you want to apply the policy:
- Select a property.
- Select an operator to create the condition. The available operators depend on the property that you select.
- Specify a value for the selected property.
- (Optional) To add more than one condition, click the

- (Optional) To group the conditions, use the parentheses and Boolean operators from their corresponding lists.
- Click Save to validate the creation of the policy.

Configure the Storage Analyzer Monitor Properties
Once the Storage Analyzer policy is created and configured, Storage Analyzer is loaded by the Agent. Then, the Storage Endpoint Type must be properly configured to start collecting performance and capacity data.
To configure the Storage Endpoint Monitor Type:
-
Create a policy or edit an existing policy.
-
Click the Monitoring tab.
-
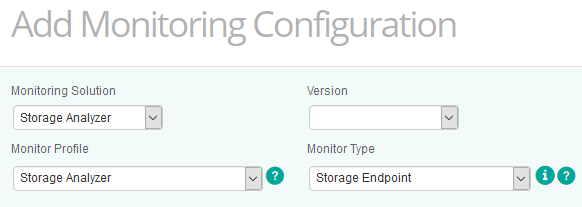
Click Add Monitoring Configuration to configure the Monitor Type properties:
-
From the Monitoring Solution menu, select Storage Analyzer.
-
From the Version menu, select the required version. The Monitor Profile and Monitor Type information are automatically selected.
-
Click Add in the Storage Configuration section to configure monitoring, connection and advanced settings for the endpoint you wish to monitor.

Monitoring Settings
The endpoint settings allows you to identify. In the Endpoint Settings section, provide the following information:
- Internal ID: Enter an ID that will identify the endpoint.
- Hostname/IP Address: Enter the hostname or the IP address of the endpoint you wish to monitor.
- From the Storage Intelligence Adapter drop-down list, select the adapter that matches the endpoint platform. This will determine which Storage Intelligence Adapter Storage Analyzer will use to query and retrieve performance and capacity metrics from the endpoint. If Other SI Adapter is selected, enter the Storage Intelligence Adapter filename in the Other Storage Intelligence Adapter field below (the filename is case insensitive).
- Hardware Monitoring: Select to enable the monitoring of the hardware components for the selected storage platform via Hardware Sentry KM. This option is only available when Hardware Sentry KM for PATROL version 11.0.01 or higher is installed and loaded on the PATROL Agent and if the selected Storage Intelligence Adapter contains the hardware connector details. Refer to Install the KM for details.
- (Optional) Enter the FQDN to associate the system to another endpoint in TrueSight. The FQDN uniquely distinguishes an endpoint from any other system and ensures that an endpoint monitored via their management cards or through controllers, for example, is properly identified.
Storage Analyzer comes with a library of Storage Intelligence Adapters (*.si files) that describe how to discover endpoints and retrieve capacity and performance data for all their discovered components. Make sure to have correctly installed the latest Storage Intelligence Library.
Connection Settings
The connections settings are mandatory to establish a connection between Storage Analyzer and the monitored endpoint. Provide the following information:
- Enter the Username, Password and Token to use to establish the connection with the endpoint.
- Specify the Port Number. By default the port is set to 5989. Refer to the Storage Intelligence Library to find the default port number used by a specific system.
- For encrypted connections, check the Encryption option.
Advanced Settings
The advanced settings allows you to fine tune the monitoring settings of an endpoint to better suit your specific needs:
- Discovery Interval: Storage Analyzer periodically performs discoveries to detect new components in your monitored endpoint. By default, the solution runs a discovery every 60 minutes, but you can customize this interval to match your specific needs. Enter the frequency (in minutes) of the discovery process.
- Polling Interval: Storage Analyzer polls the monitored endpoint to collect performance and capacity data. By default, the polling interval for data collection is set to every 2 minutes. Enter the interval at which the solution must poll the monitored endpoint to collect data.
- Engine Timeout: Specify the time in minutes after which the engine should be stopped when querying the endpoint
- Query Timeout: Specify the time allocated to individual queries.
- Disable Volume Monitoring: Check this option to disable discovery and data collection for volumes on the endpoint. Volumes will no longer appear in the Console.
- Hide Volume Instances: Uncheck this option to create individual instances for each volume discovered on the endpoint. For performance and scalability reasons, it is recommended to keep this option enabled.
Configure Global Settings
Configuring the Global Settings consists in defining specific actions to be executed when a storage problem is detected, and customize the way notifications are conveyed. It also allows you to define how the detection of missing devices must be handled by the solution.

-
From the Add Monitoring Configuration of the policy, scroll down to the Global Settings section.
-
Define the alert action you wish Storage Analyzer to perform Upon a Storage Problem and Upon a Collection Problem:
- A Specific PATROL Event (Default)
- A STD 41 PATROL Event
- No Event
-
The Enable Annotations option makes the solution annotate the parameter’s graph with a comprehensive report of the problem. Annotations are enabled by default. Uncheck the option if you do not want graphs to be annotated.
-
The Write to This LOG File option enables you to enter the path of a log file where Storage Analyzer will write information about the problem.
-
The Missing Device Detection option enables you to deactivate alerts on the Present parameter of devices that go missing during monitoring or after a system reboot.
-
Click OK to save your settings.
(Optional) Configure Thresholds
By default no global thresholds are set in TrueSight. To take full advantage of Storage Analyzer KM for PATROL, Sentry Software recommends setting thresholds as specified in the Reference Guide.
Three type of thresholds exist in TrueSight:
- Global thresholds: Infrastructure Management Server-side thresholds (Absolute, Signature and Abnormality) managed from the TrueSight console, applicable to all monitors in a realm.
- Server thresholds: Same as above, but defined in a monitoring policy and therefore applicable to a subset of agents. Such thresholds can be set at the monitor type or monitor instance level.
- Agent thresholds: “Classic” range-based thresholds defined on the BMC PATROL Agents. They can be set at the monitor type or monitor instance level.
PATROL events generated by the Sentry Software's KMs provide more information about the failure. Sentry Software therefore recommends setting agent thresholds over global or server thresholds.
Setting Agent Thresholds
-
Edit your monitoring policy:
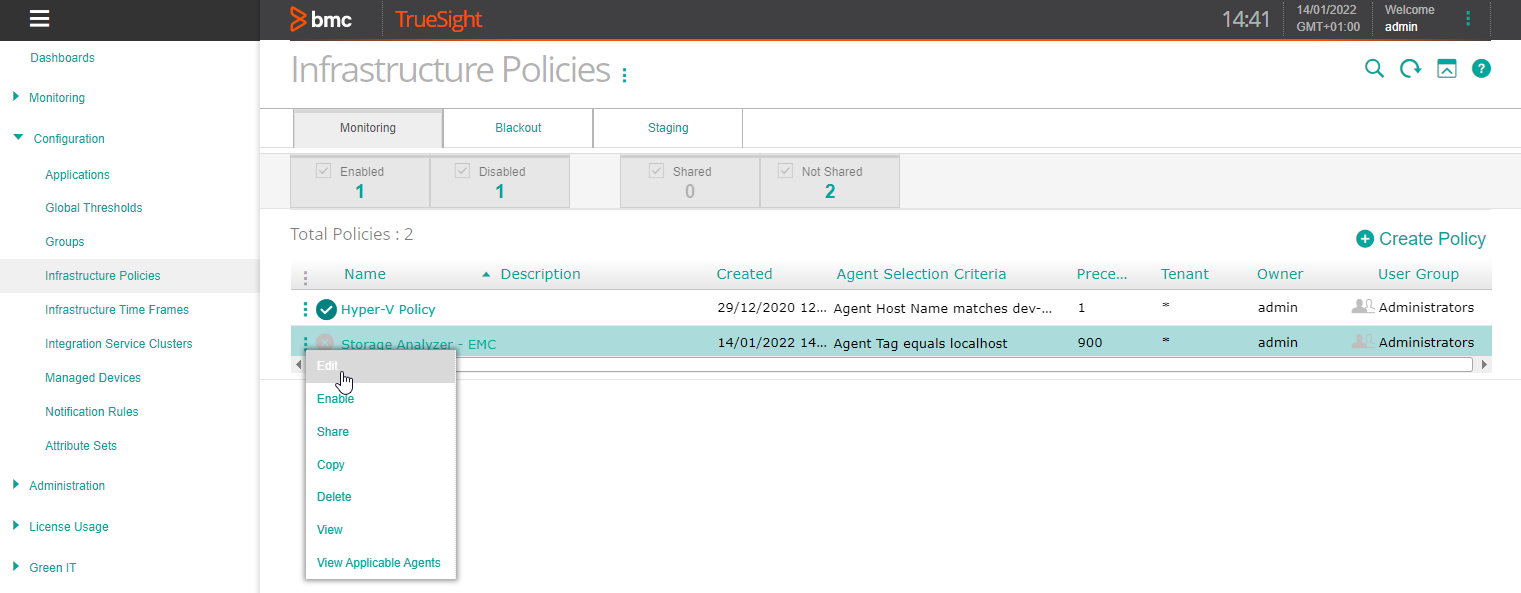
- Log on to the TrueSight console.
- In the navigation pane, expand Configuration and select Infrastructure Policies.
- In the Infrastructure Policies page, locate the monitoring policy you wish to modify, click its action button

-
Select the Agent Thresholds tab and click Add Agent Threshold.
-
Select Storage Analyzer as the Monitoring Solution, the Version, the Monitor Type, the Scope and the Monitor Attribute.
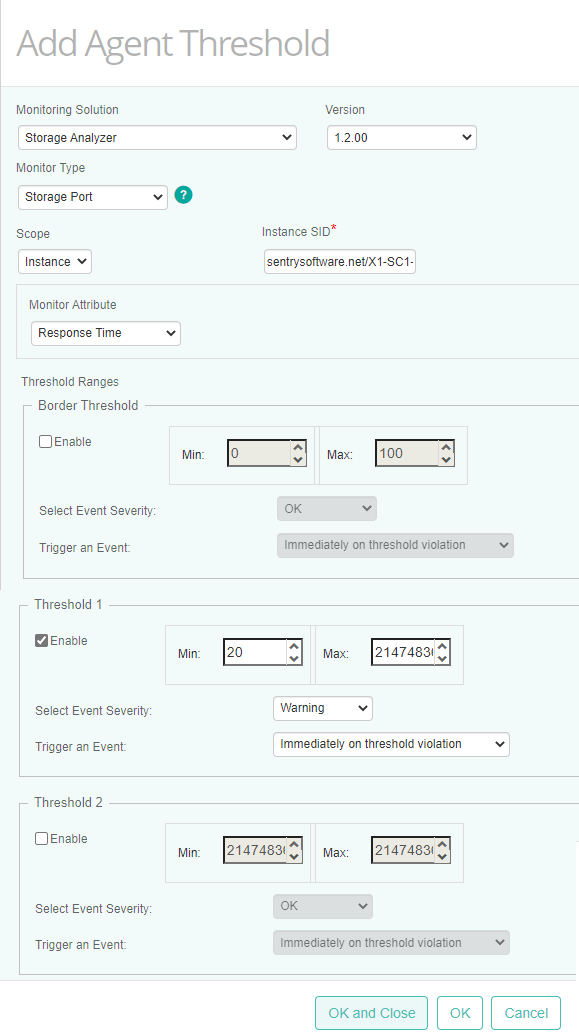
The Instance SID is required when setting thresholds at the instance level. You will find that information in the TrueSight Infrastructure Management console by placing the cursor on the required instance.
-
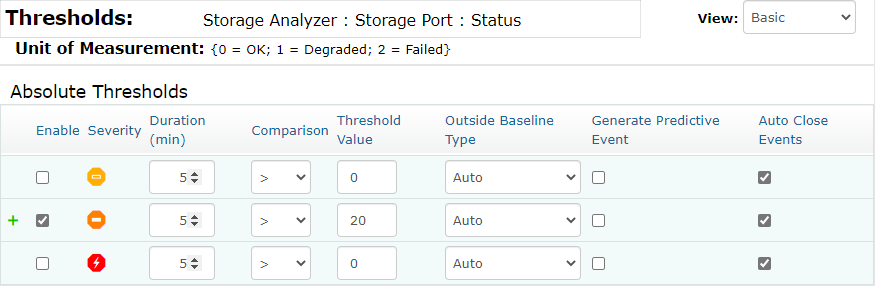
Specify under which conditions events will be triggered. In our example, a warning will be triggered when the response time of a specific port is above 20ms.
-
Click OK
-
Click Save.


Setting Global Thresholds
Storage Analyzer ships with predefined thresholds that can be imported into TrueSight Operations Management:
- Download SKM_thresholdtemplate.csv
- Copy the content of SKM_thresholdtemplate.csv to the thresholdtemplate.csv file located in _<TrueSight Presentation Server installation directory>_\TrueSightPServer\truesightpserver\modules\cma on your TrueSight server
- If required, in the resulting thresholdtemplate.csv file, replace
bmcrealmwith the name of the tenant (from version 11 of TrueSight Operations Management, you can use*to apply these thresholds to all tenants) - From a command-line interface, go to _<TrueSight Presentation Server installation directory>_\TrueSightPServer\truesightpserver\bin and execute the command below:
tssh.bat thresholdtemplate import

+-------------------------------------------------------------------------------------------+
|   BMC TrueSight Presentation Server - Command Line Interface 2017 version 11.0            |
|   Copyright 2014-2017. BMC Software, Inc. as an unpublished work.  All rights reserved.   |
+-------------------------------------------------------------------------------------------+


Importing thresholds template....

Importing thresholds from file "C:/Program Files/BMC Software/TrueSightPServer/truesightpserver\modules\cma\thresholdtem
plate.csv"
Successfully imported thresholds template
You can further customize these global thresholds:
-
Log on to the TrueSight console.
-
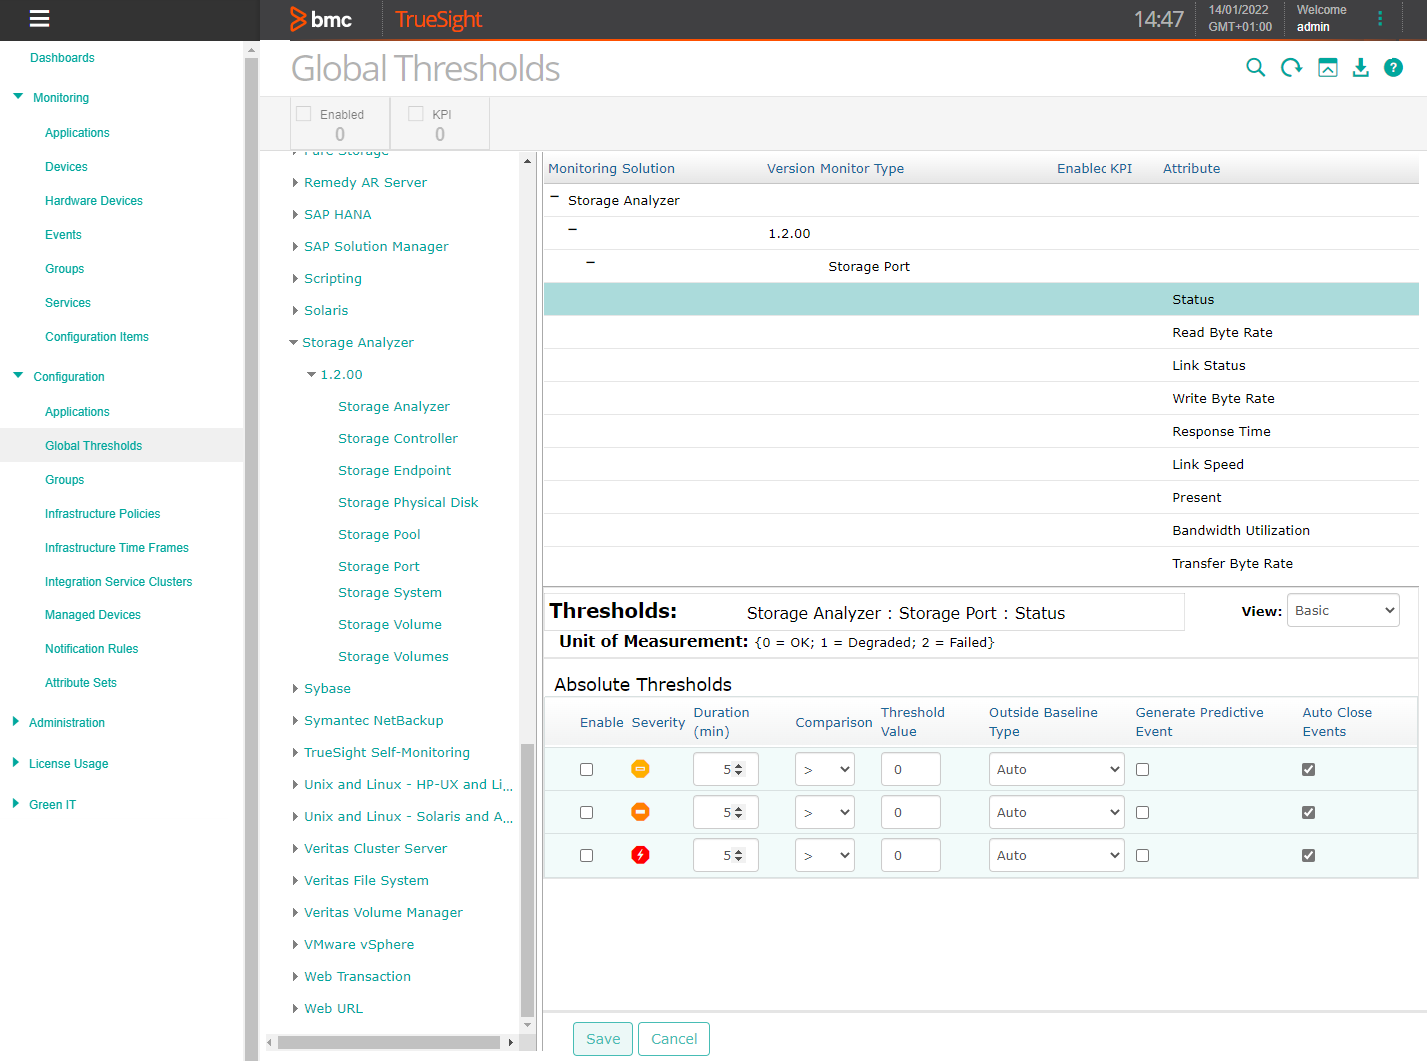
In the navigation pane, expand Configuration and select Global Thresholds.
-
Expand Storage Analyzer and select the required version. All the monitors and attributes are displayed on the right pane.
-
Select the attribute for which you wish to set global thresholds. In our example: Response Time
-
In the bottom pane, specify under which conditions events will be triggered. In our example, an event of severity “Major” will be triggered when the response time of the ports is above 20 ms for more than 5 minutes.


Setting Server Thresholds
Server thresholds configured for a specific policy will override the global thresholds set in the TrueSight console.
-
Edit your monitoring policy:
- Log on to the TrueSight console.
- In the navigation pane, expand Configuration and select Infrastructure Policies.
- In the Infrastructure Policies page, locate the monitoring policy you wish to modify, click its action button
-
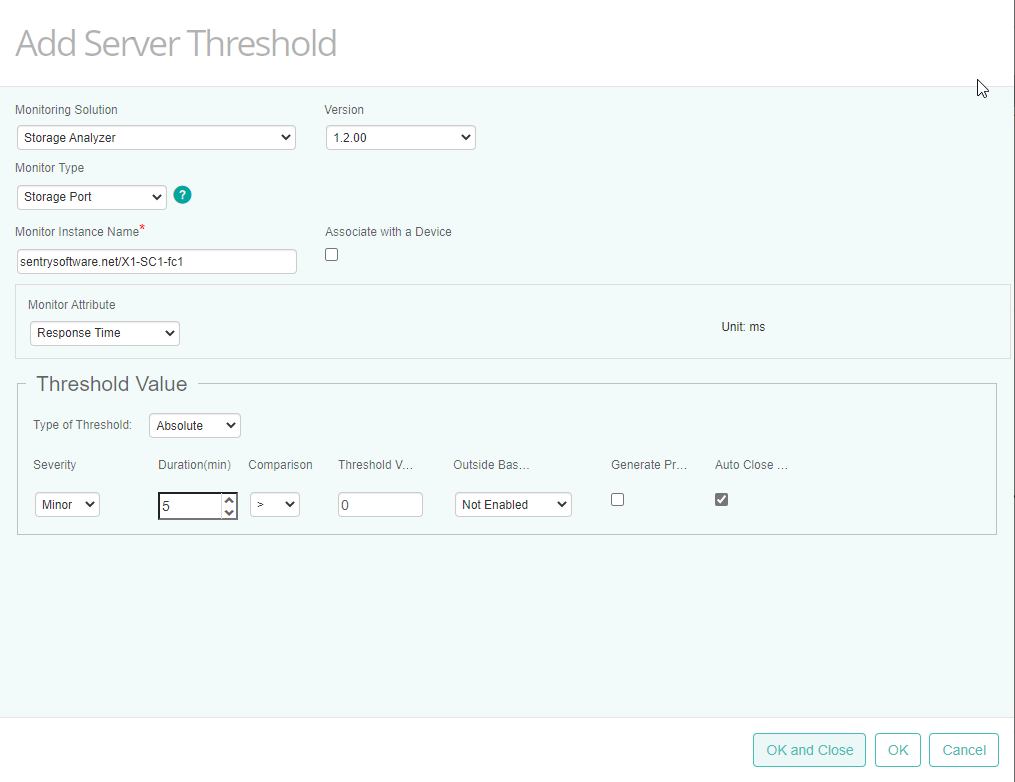
Select the Server Threshold tab and click Add Server Threshold
-
Select Storage Analyzer as the Monitoring Solution, the Version and the Monitor Type.
-
Enter the Monitor Instance Name and select the Monitor Attribute.
-
Specify under which conditions events will be triggered. In our example, an event of severity “Major” will be triggered when the response time of the specified port is above 20 ms for more than 5 minutes.
-
Click OK
-
Click Save.

Edit a Monitoring Policy
- Log on to the TrueSight console.
- In the navigation pane, expand Configuration and select Infrastructure Policies.
- In the Infrastructure Policies page, locate the monitoring policy you wish to modify, click its action button
- In the Edit Monitoring Policy page, locate the monitoring configuration you wish to modify and click its action button
- Customize the configuration.
- Click Save to apply your changes to the selected PATROL Agent(s).